Third quarter 2024 update
A lot is new in Smartsheet, lately! Read on to learn more about some of the exciting features we’ve delivered over the past quarter, including the brand new board view, a wider dashboard canvas, more AI capabilities, and Resource Management advanced reports.
Want to explore additional recent releases? Check out our Smartsheet, Lately webinar to see these features and more in action.
Board view: A new way to visualize your work
We’re excited about the launch of the new board view in Smartsheet, designed to transform how you visualize your work, enhance flexibility, and maximize productivity using Agile Methodology.
Tasks in board view are displayed as cards on a Kanban board and can be easily prioritized and rearranged with intuitive drag-and-drop functionality. With the ability to build a task hierarchy by creating child cards directly within board view, single lane scrolling to easily locate a specific card, and improved viewing and editing of card details, you can accomplish a lot without switching views.
Plus, board view introduces continuous auto-save and real-time collaboration features so you can be sure you’ll never lose your edits or duplicate the work a team member has already done.
Whether you’re all-in on agile work management processes, or simply want a clearer way to visualize your tasks, board view has you covered. It’s available to users on all Smartsheet plans — check it out today!
Wider dashboard canvas: See more, scroll less
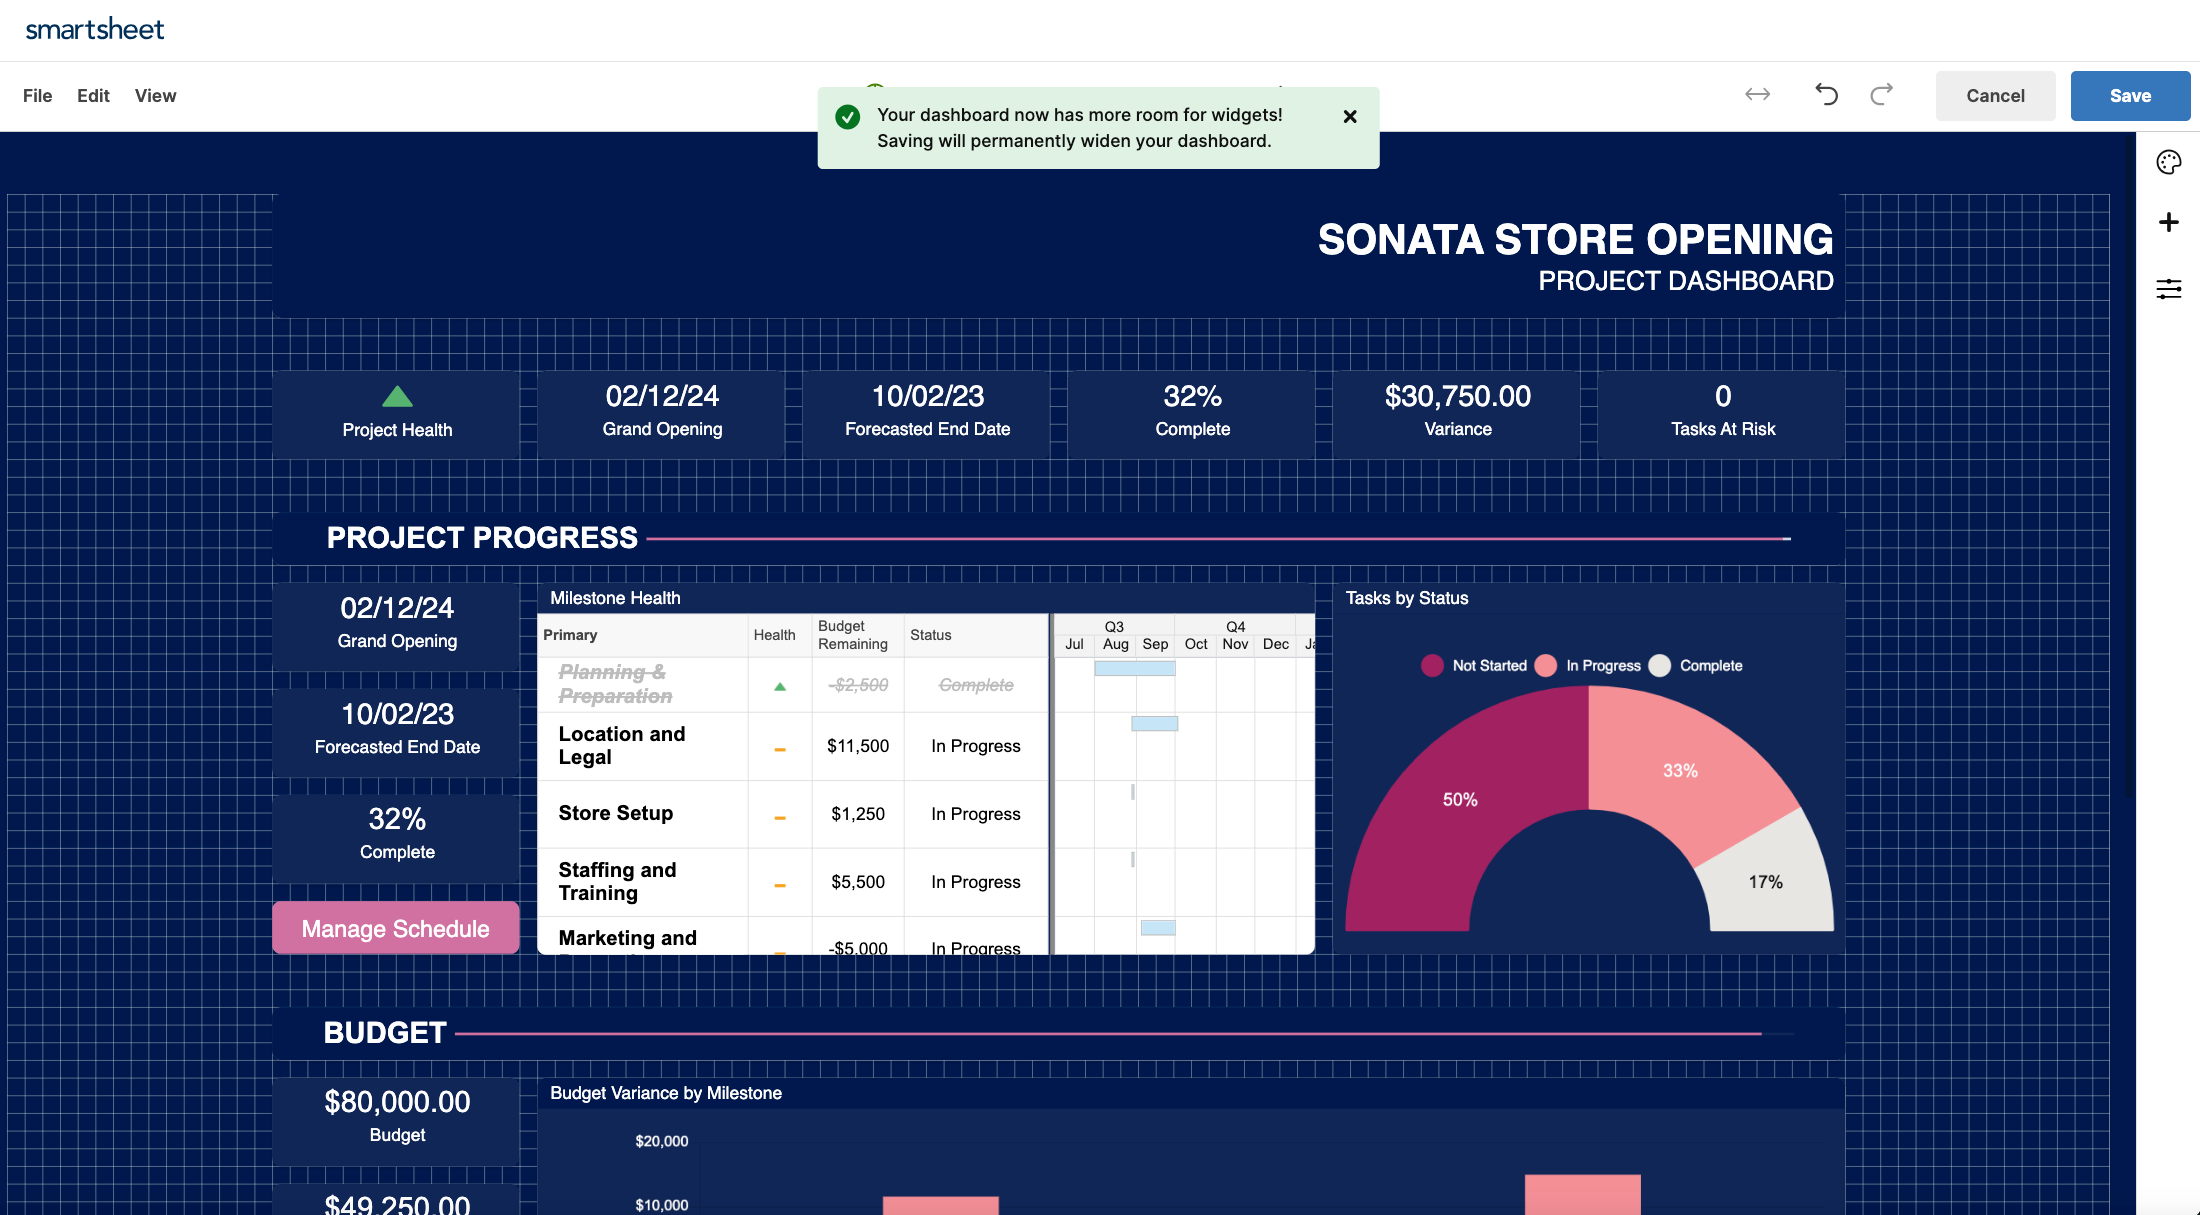
We know it can be challenging to fit all your project details on a single screen, leading to lots of scrolling on your dashboards. That’s why we’ve given you the option to make any standard-size dashboard canvas wider. Wider dashboard canvases give you more space to visualize your work on widescreen displays so you can present more content “above the fold,” making your dashboard layouts more effective than ever.
When you’re editing a dashboard, simply click on the expand icon to give yourself more room to work. It’s like spreading out your workspace for a clearer view of everything you’re managing.
We’ve also added dashboard zoom control for wide dashboard canvases to ensure that your content is readable no matter the screen size. Happy dashboarding!
Analyze data: AI data insights at your fingertips

Digging through data to produce charts and metrics that offer actionable insights can feel like a daunting task — but it doesn’t have to. Analyze data, the newest in the Smartsheet stack of AI capabilities, lets you ask questions about your data, get immediate answers, and refine the results. This helps you spend less time on meeting follow-ups, and surface meaningful metrics and create charts in real time.
To take advantage of this powerful new tool, simply navigate to any sheet, click the “Generate with AI tools” icon, then select “Analyze data.” You can enter your custom prompt in the box using conversational language, or tell the tool to “Suggest a question” to start gathering insights with the click of a button. From status breakdowns to data aggregations, simple calculations to detailed bar charts, analyze data quickly provides the analyses you need to move your work forward.
When you use analyze data to generate a chart or metric, you can also expand the “Explain this result” section for a step-by-step explanation of how the tool generated the response. That way, you can be confident in the data analysis.
The AI analyze data feature is available to users on Enterprise plans.
Resource Management advanced reports: Effortless integration, enhanced visibility

If you have Resource Management by Smartsheet, you can now use our new advanced reports feature to transfer your report data directly into Smartsheet. You can perform in-depth analysis and create visualizations in your sheet to make informed decisions about your organization’s resources.
Using advanced reports generates a new sheet in the Smartsheet folder or workspace of your choice, containing the underlying dataset from Resource Management. This data will be automatically updated each day, or can be manually refreshed on demand, so you can always access the most up-to-date data directly within Smartsheet.
The Resource Management advanced reports feature will also create a Smartsheet report that you can customize by adding columns, groupings, sorts, and more to create a view of the data that will be most meaningful to you.
Integrating Resource Management reports into Smartsheet also means you can merge Resource Management data with other data you have in Smartsheet, create dashboards and WorkApps, and leverage Smartsheet automation capabilities, enhancing visibility and decision-making.
We’ll be back next quarter with more exciting Smartsheet capabilities and enhancements. In the meantime, check out our Smartsheet, Lately webinar to explore these features and more in action. And, be sure to visit our release news page and subscribe to receive emails about all the additional features and updates we’re adding to help you maximize the work that matters — yours!
