
Welcome back to our dashboard design series! If you’re new, we’ve previously explored fun topics like strategic color use, secret design tools, and example color themes. Today, we're focusing on arguably the most crucial aspect of dashboard design – the layout.
This post will guide you through the steps below to create an effective dashboard layout:
- Determine your dashboard's purpose.
- Be aware of common mistakes.
- Sketch your dashboard.
- Plug in real content.
- Adjust, get feedback, and never stop refining.
Whether your goal is to inform stakeholders, bookmark information, or prompt action, these best practices will bring your dashboard vision to life.
All effective layouts start from a place of purpose
Jumping straight into dashboard creation without planning is like diving headfirst into chaos. To avoid ending up with a disorganized mess, take a moment to figure out your dashboard's purpose. Sketching out your layout helps you visualize the final product and ensures it will meet your audience's needs. A little planning goes a long way in making a functional and effective dashboard.
Defining your dashboard’s purpose
To determine your dashboard's purpose, start by clarifying the audience. Then ask yourself; what key questions does this dashboard need to answer for your stakeholders? Are you informing stakeholders with data, bookmarking important information and metrics for easy reference, or prompting specific actions based on insights?
Understanding your audience and determining the primary goals of your dashboard will define the content you’ll need to put on your canvas. Once you know how much content you’re working with, you’ll be in a better position to think about the layout of your dashboard more holistically, which is key for an effective layout design.
From layout sketch to layout success
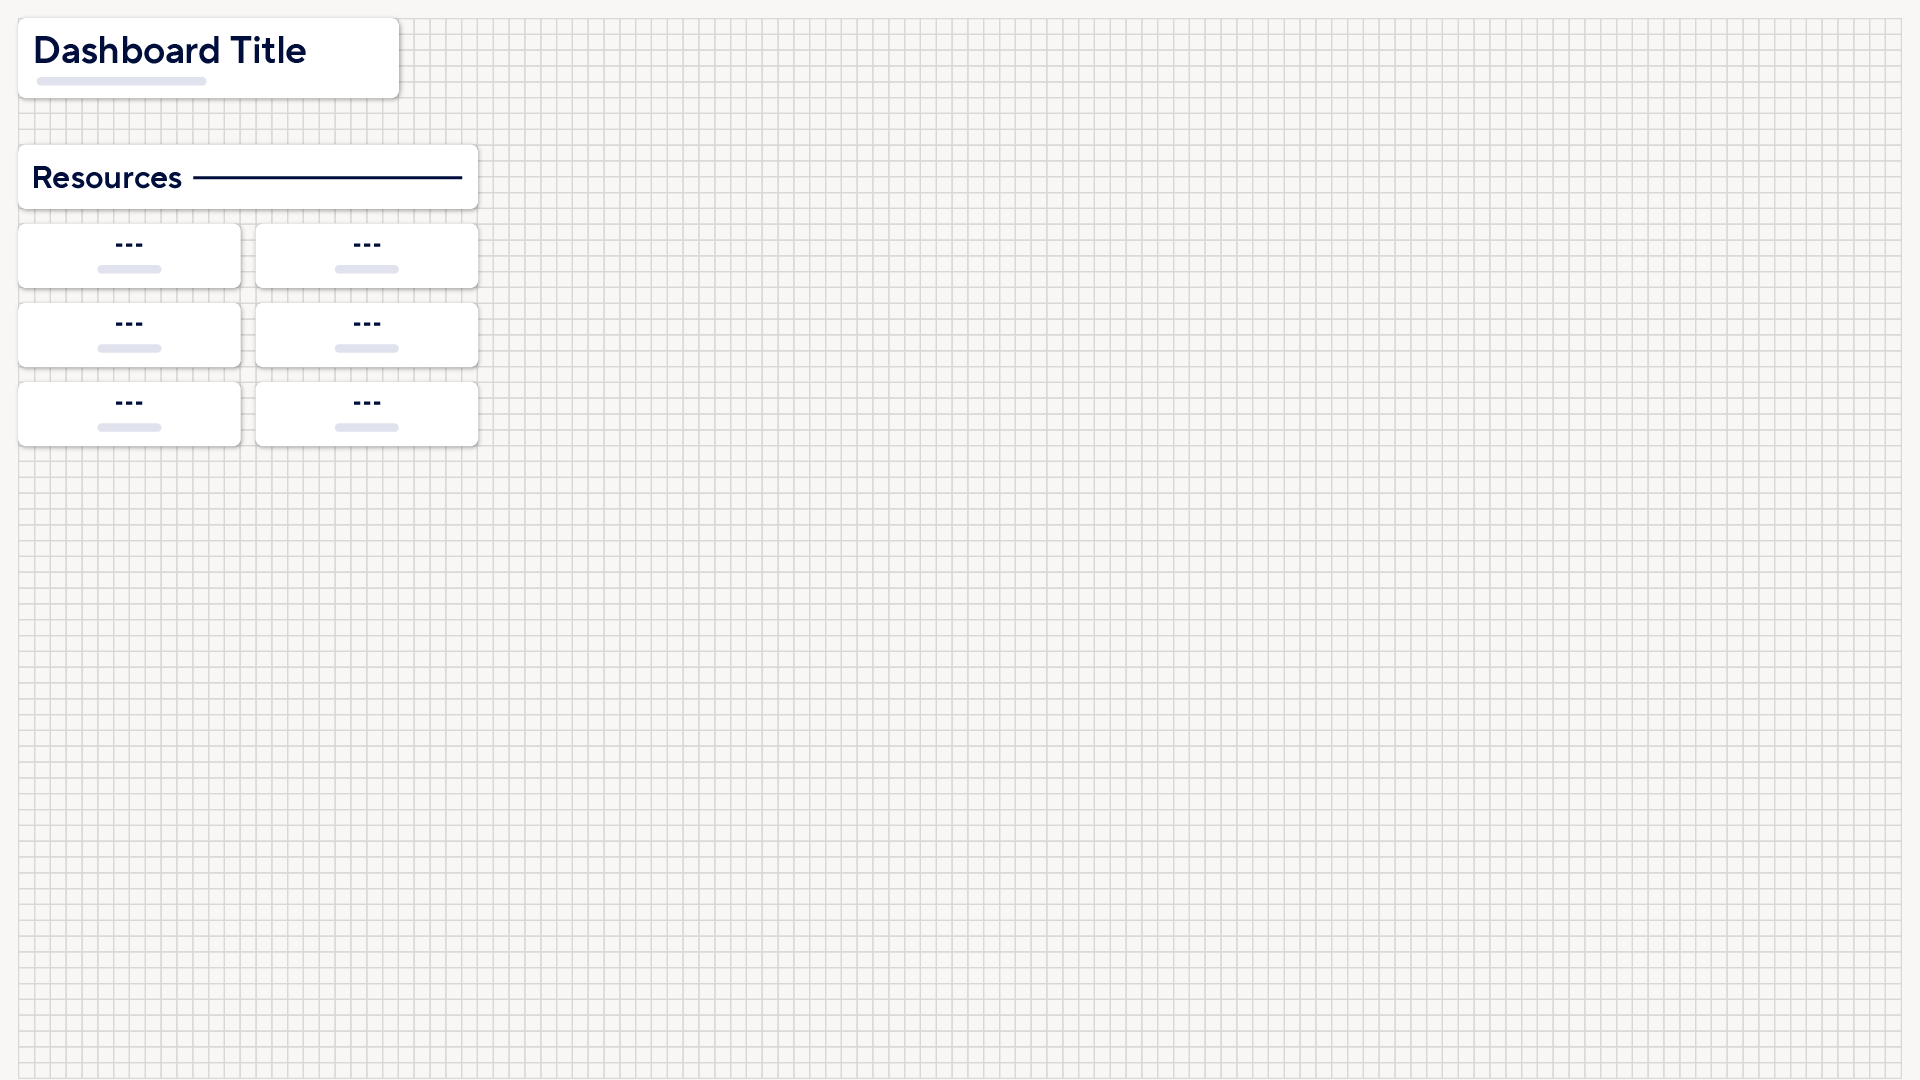
Once you’ve identified your dashboard's purpose, start sketching! You can do this by creating a new dashboard and using title widgets as placeholders, or with a pen and paper. I like building directly in Smartsheet so it’s easier to transition into a real dashboard (I also like using dashboard zoom to see my layout from a bird's eye view when I want to ensure layout consistency).
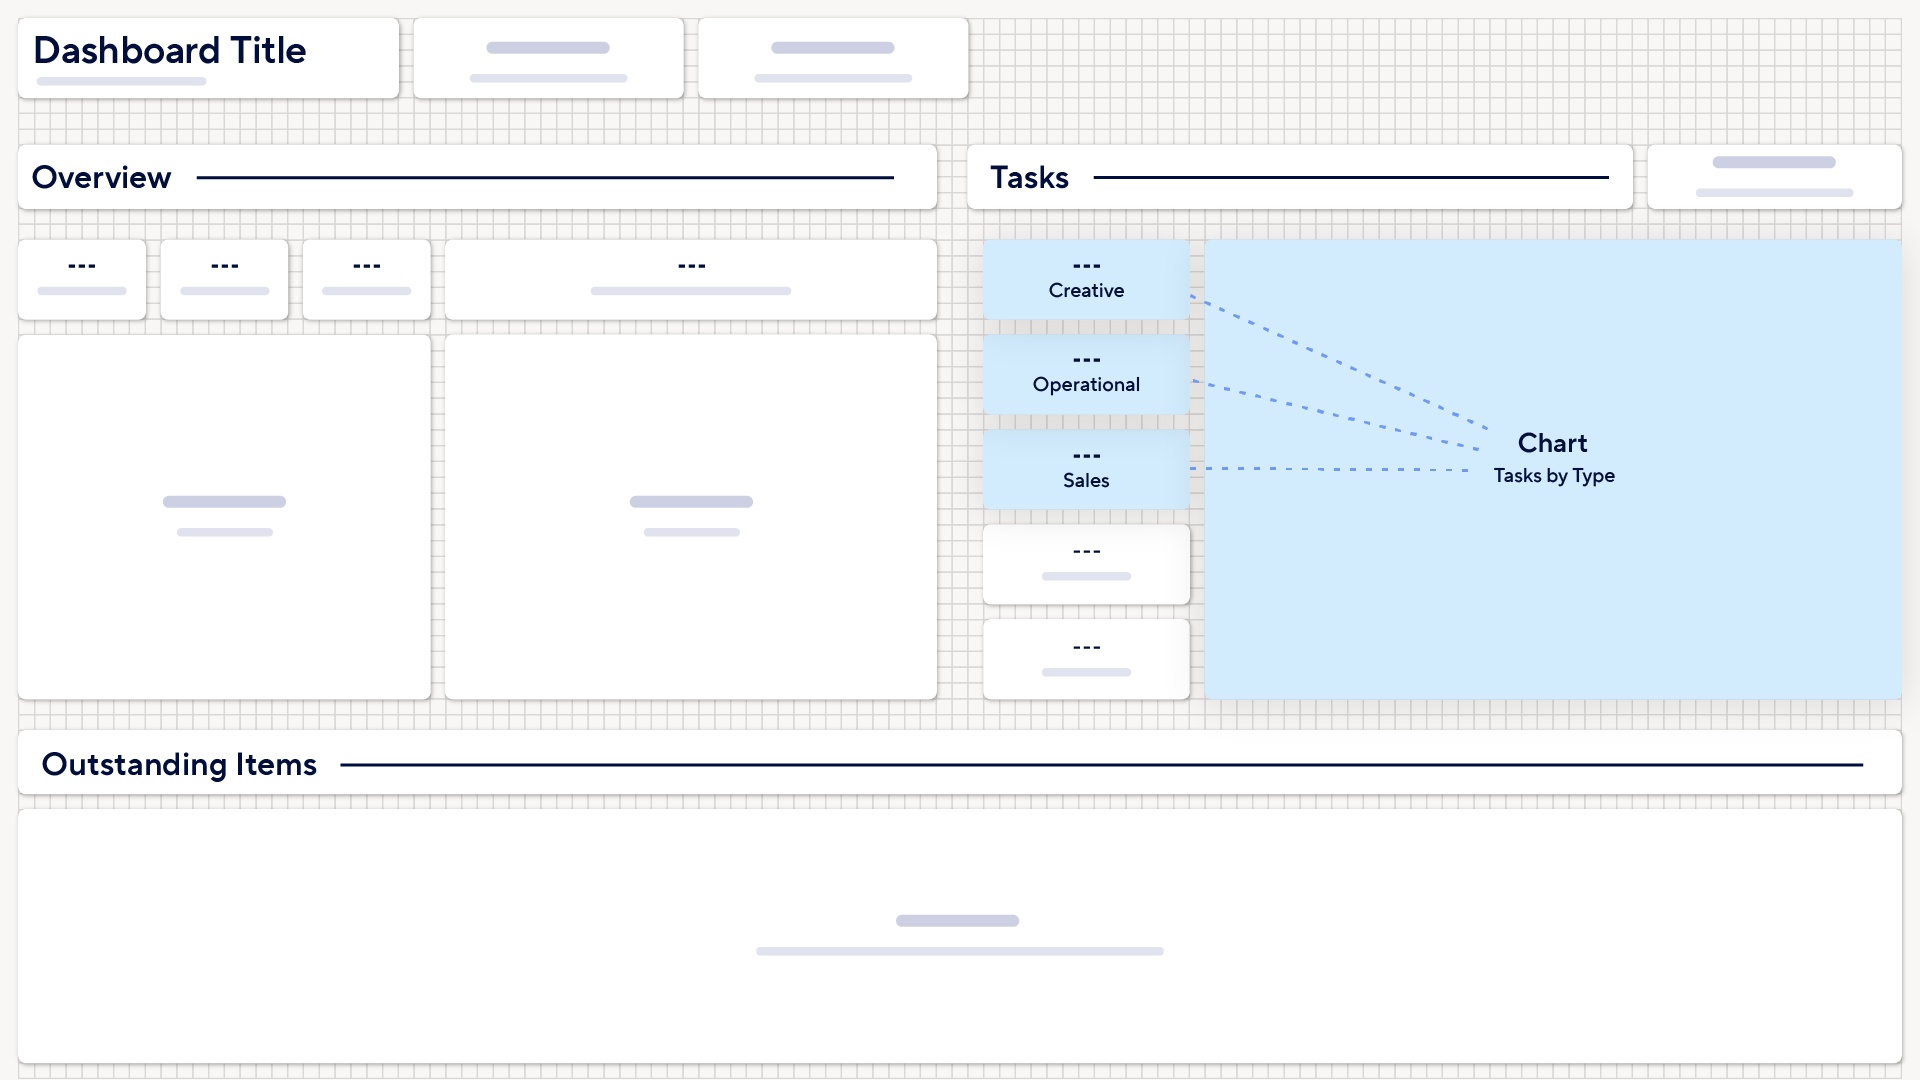
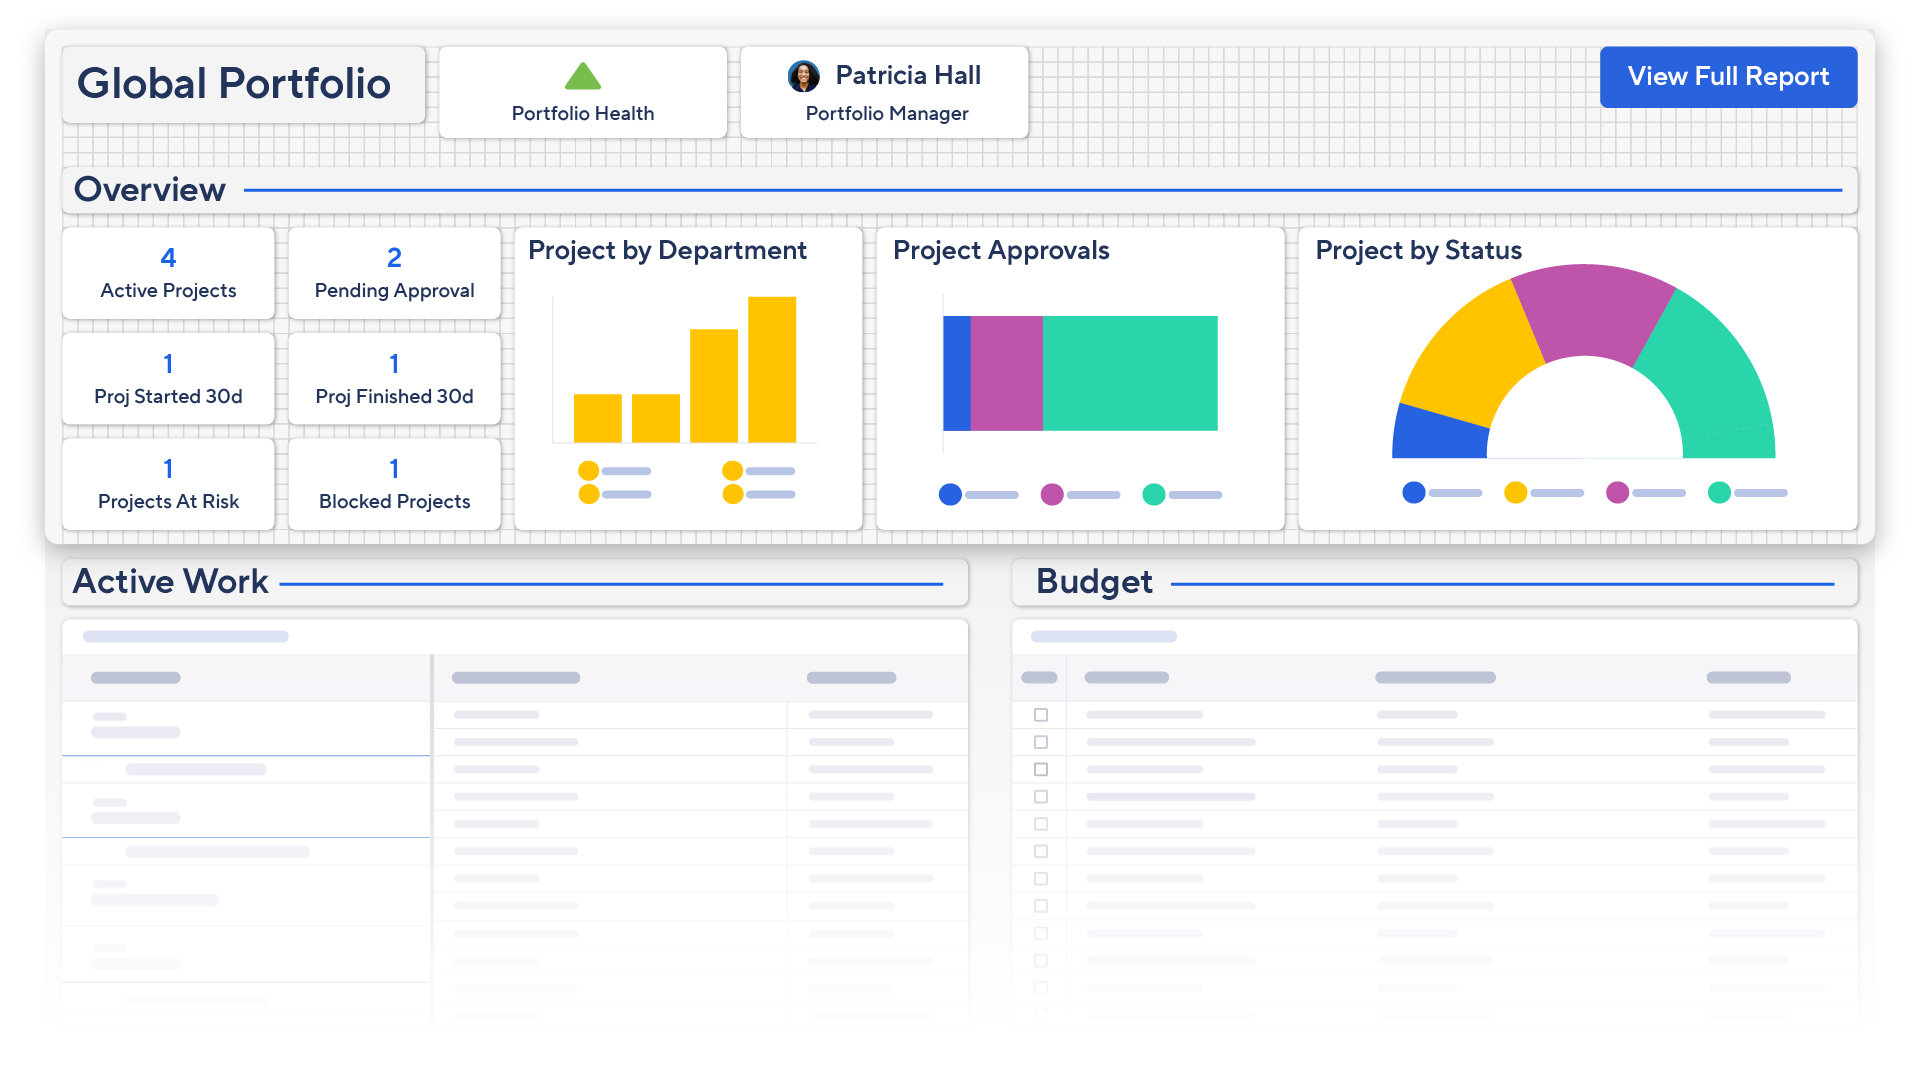
If you’re trying to inform stakeholders with data, you’ll want to make sure any charts, important metrics and reports are toward the top of your dashboards and logically organized for readability.
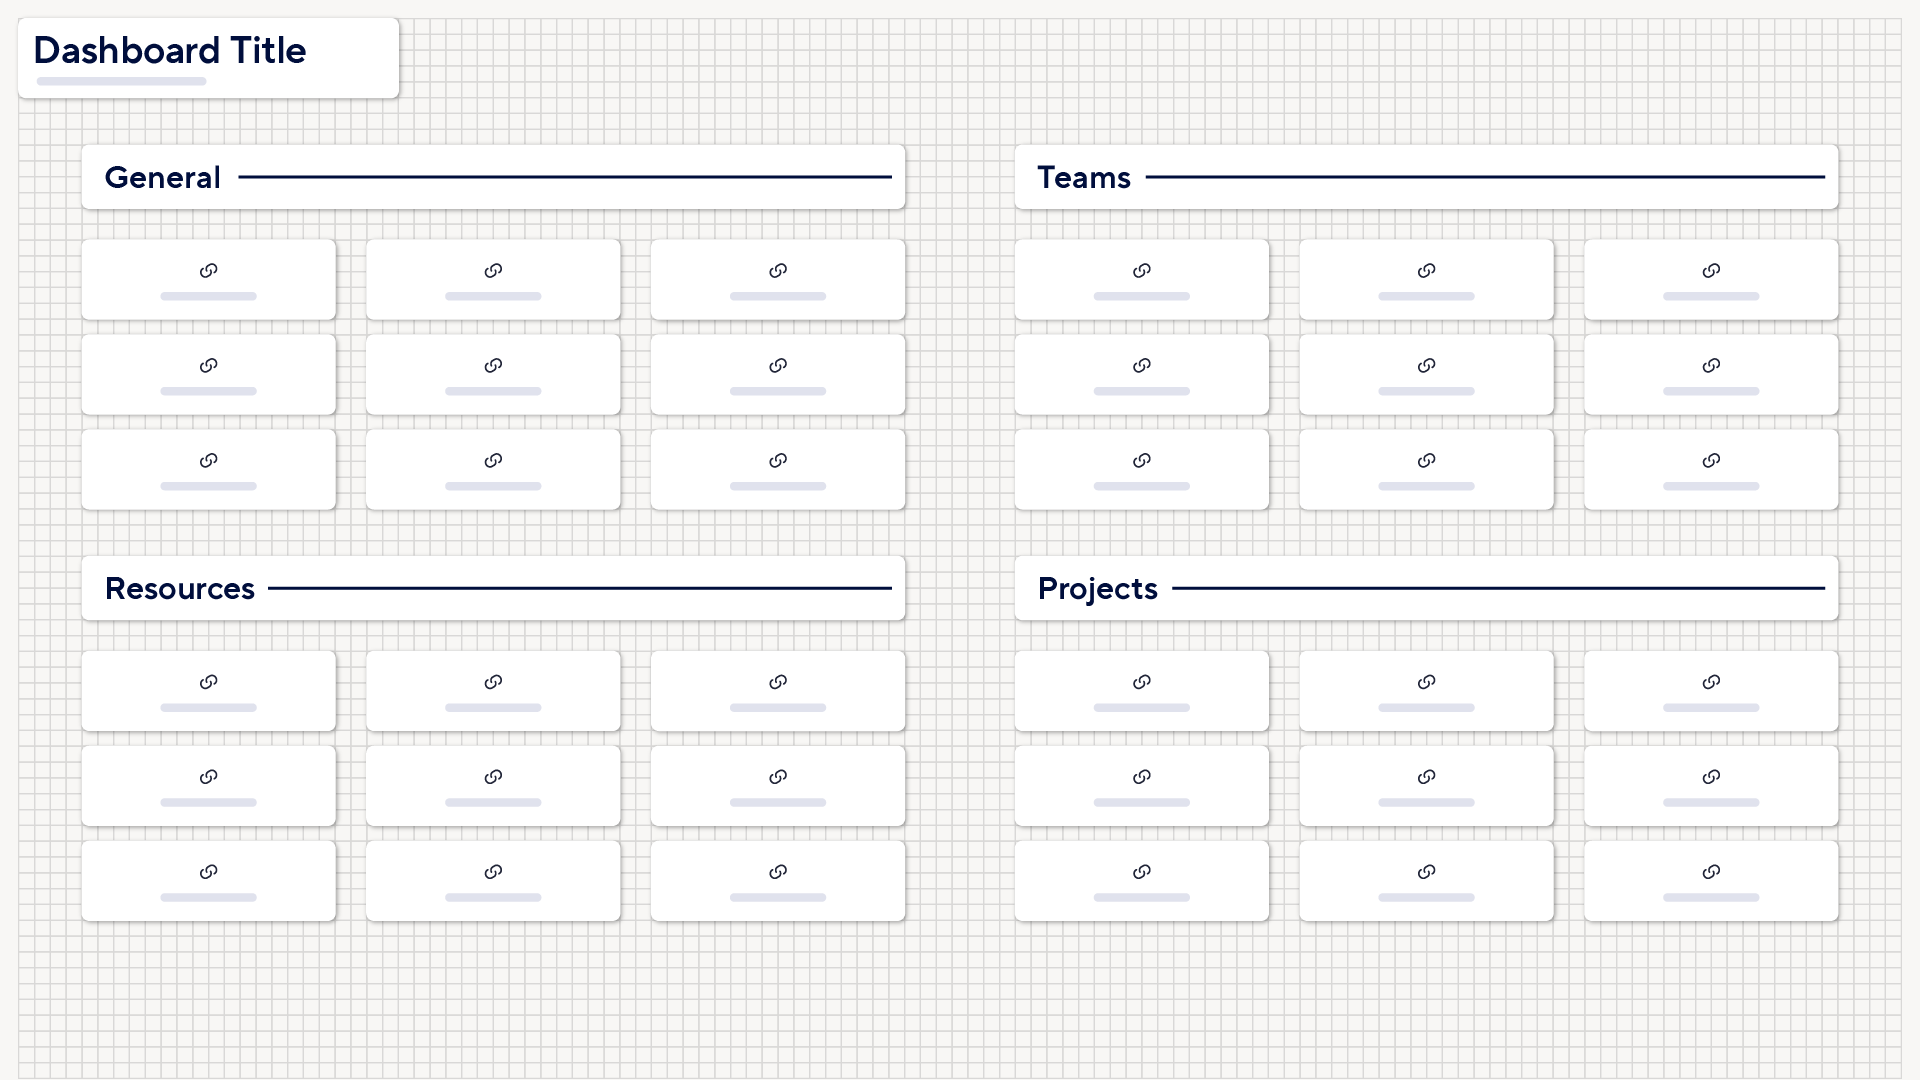
If your dashboard is serving more as a library of important links and bookmarks then you’ll want to make sure those bookmarks are properly organized into smaller, more consumable sections so they can be read through easily.
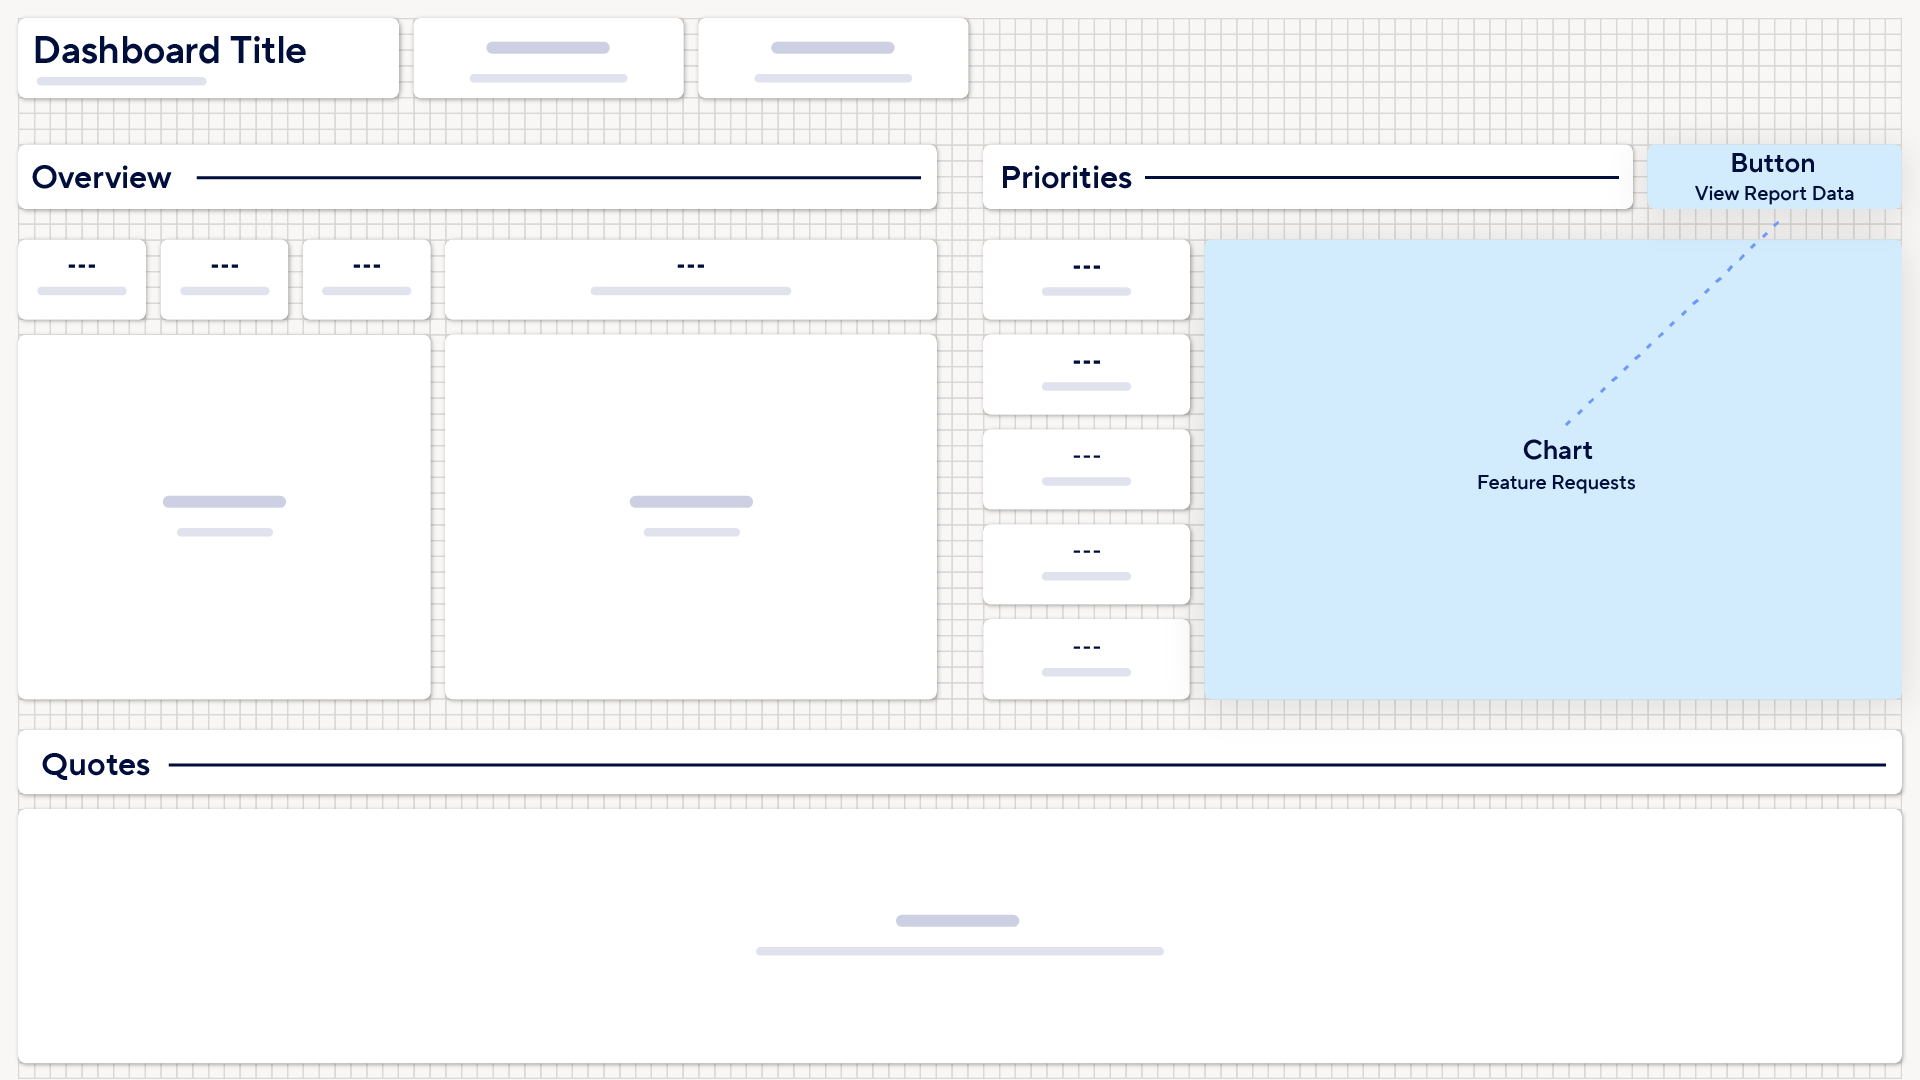
Or, if your dashboard needs to provide insight and prompt action, you’ll want to make sure you have both your data and call-to-action buttons present above the fold. And you’ll want to place your CTA’s near the insights you expect to prompt action.
Common mistakes are common for a reason
Overcrowding and Undercrowding
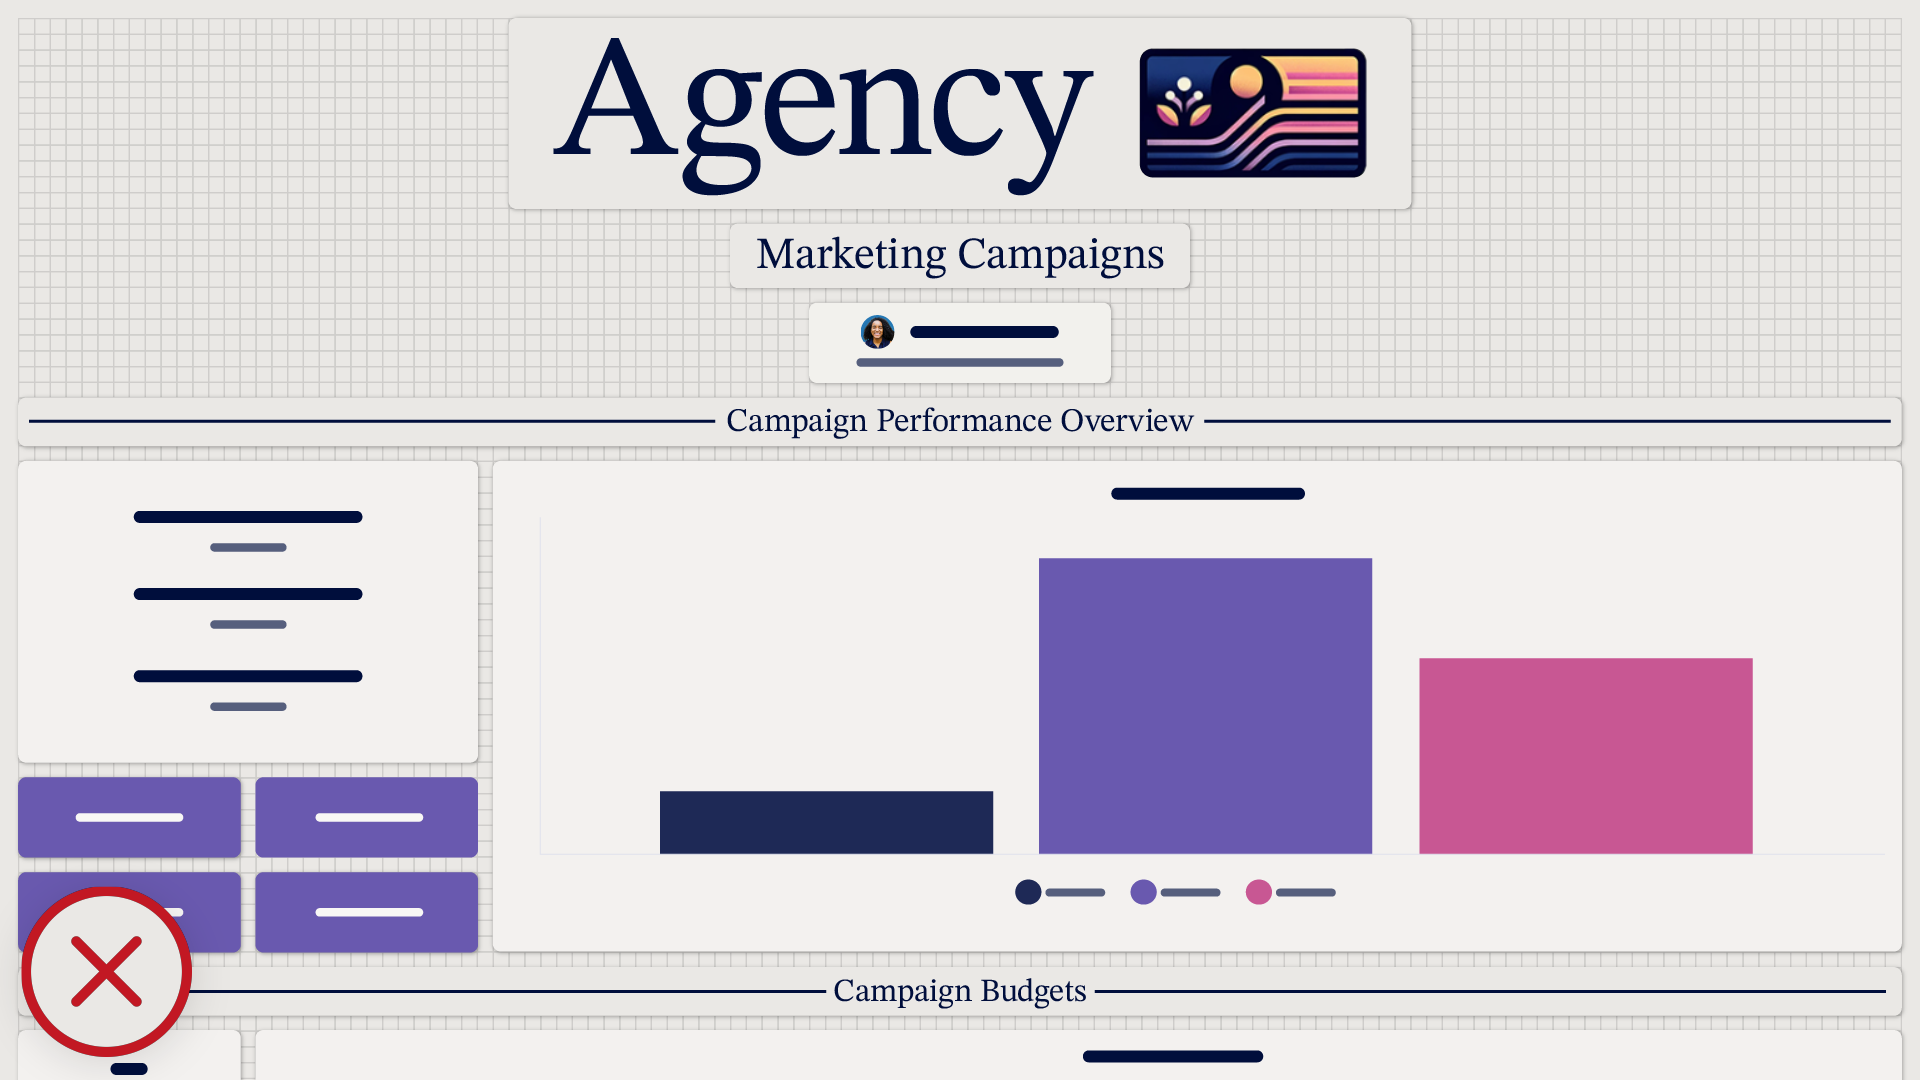
We’ve all been there, excited to add every possible piece of information to our dashboard, only to end up with a cluttered mess. When you cram too much information into a tight space, it becomes muddy and hard to read. Think of it like trying to fit all your favorite clothes into one suitcase—it’s just not practical.
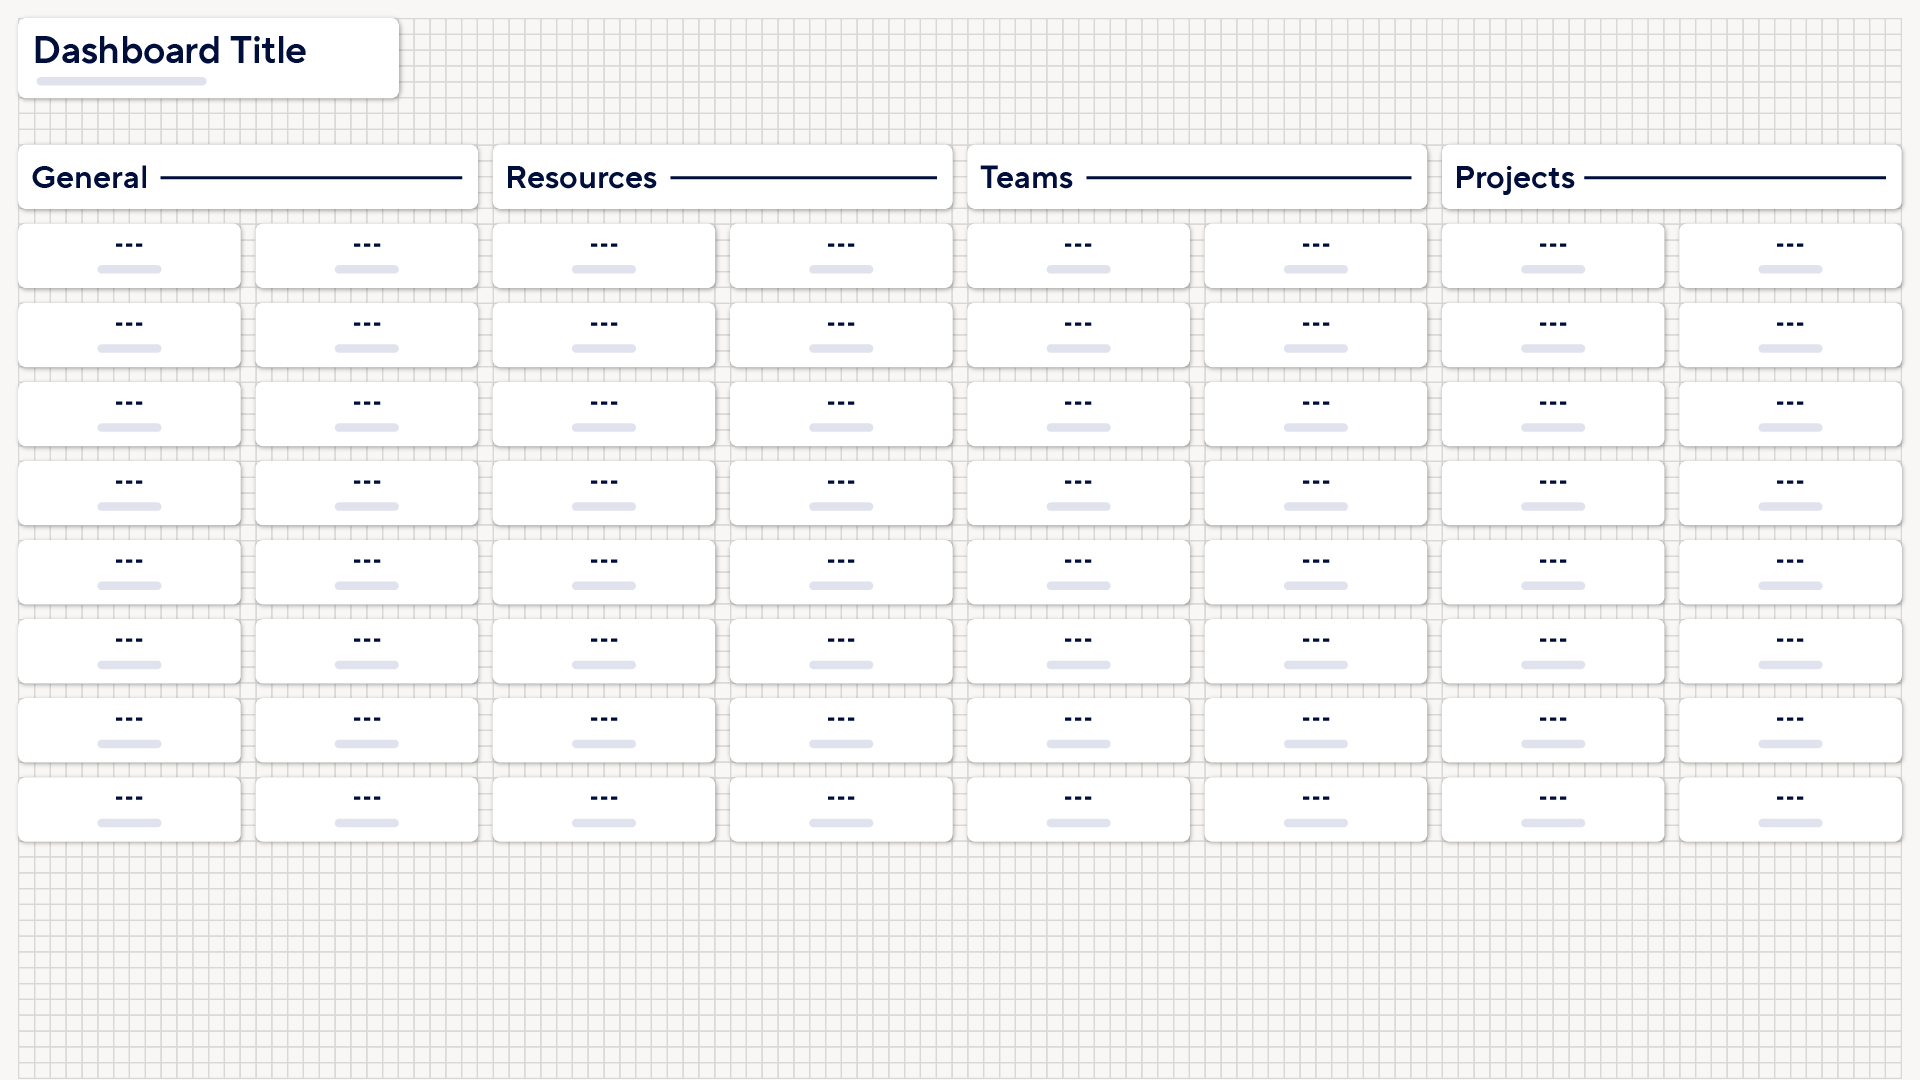
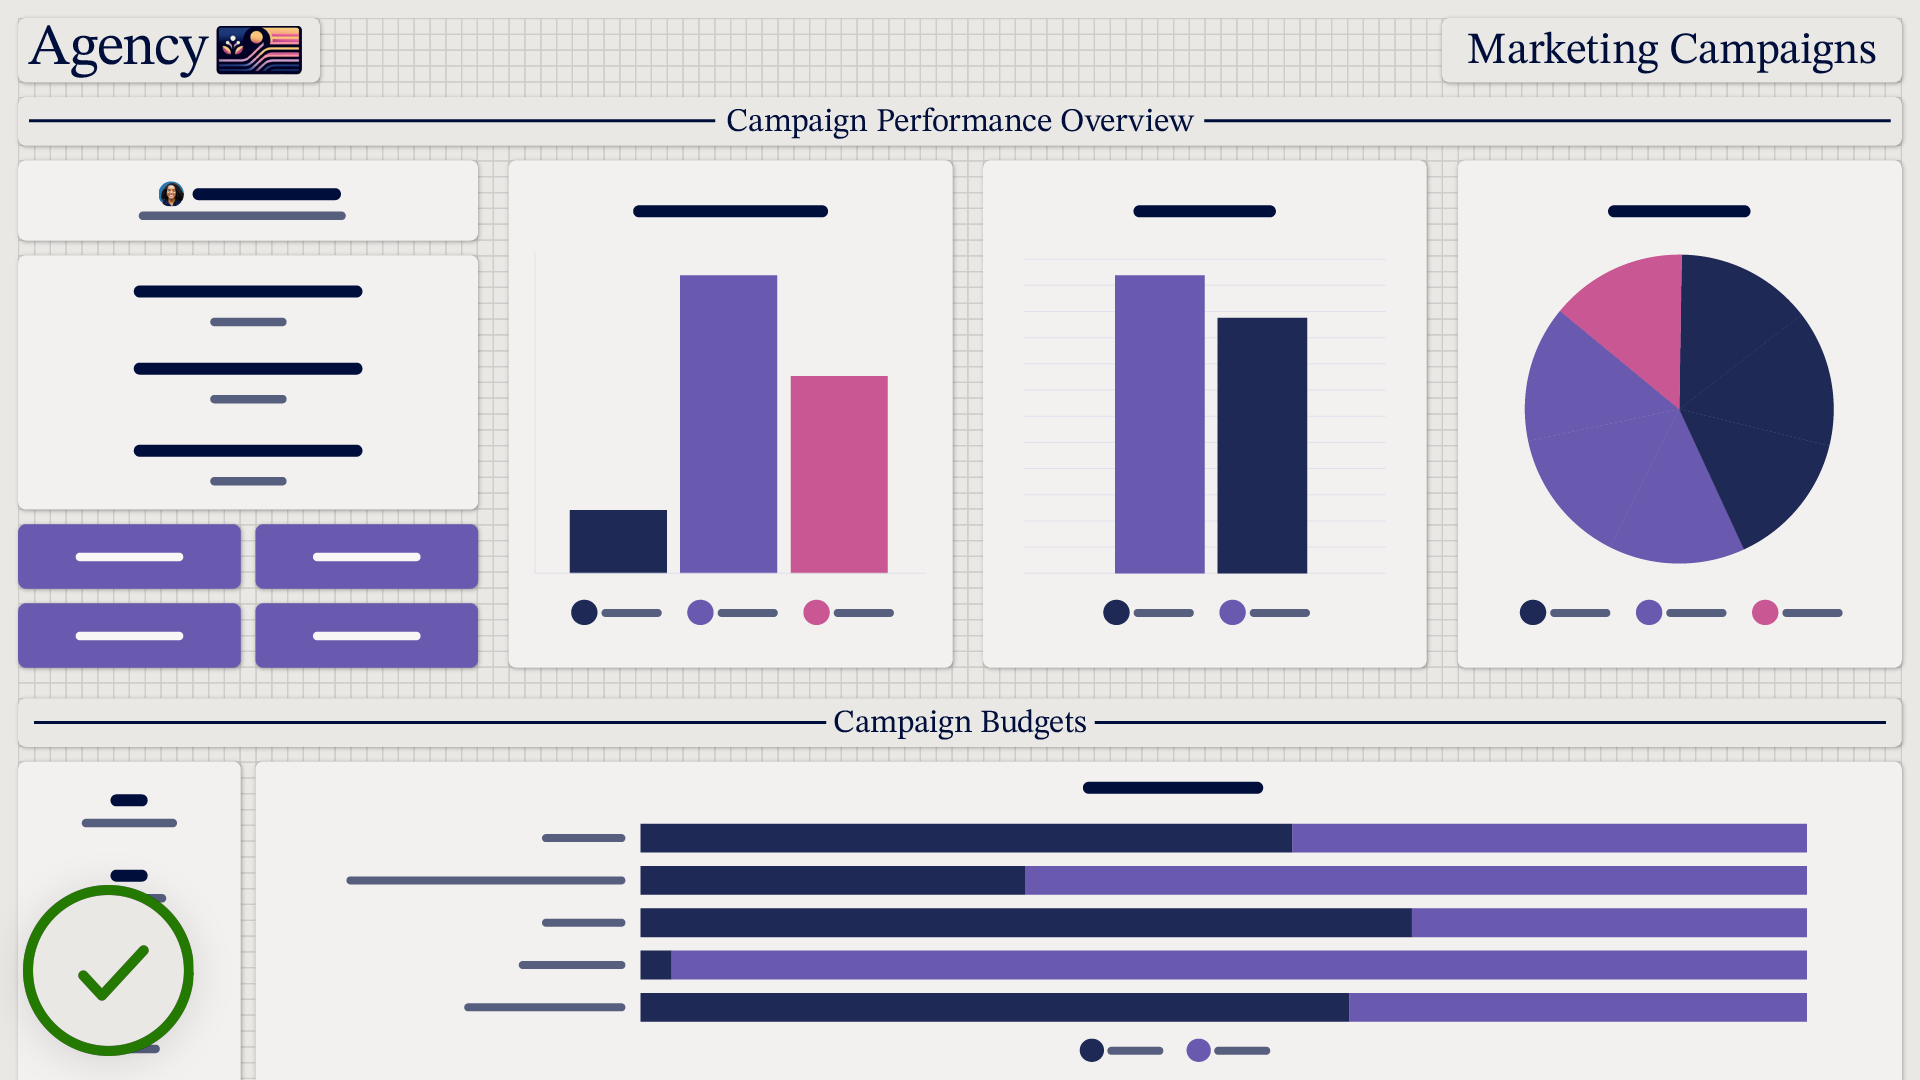
On the other end of the spectrum, undercrowding can make your dashboard look sparse and uninformative, like a half-empty closet. Prioritize clarity and readability by balancing the amount of content, giving your data the breathing room it needs to shine, while also ensuring your dashboard is filled with enough valuable information to be useful.
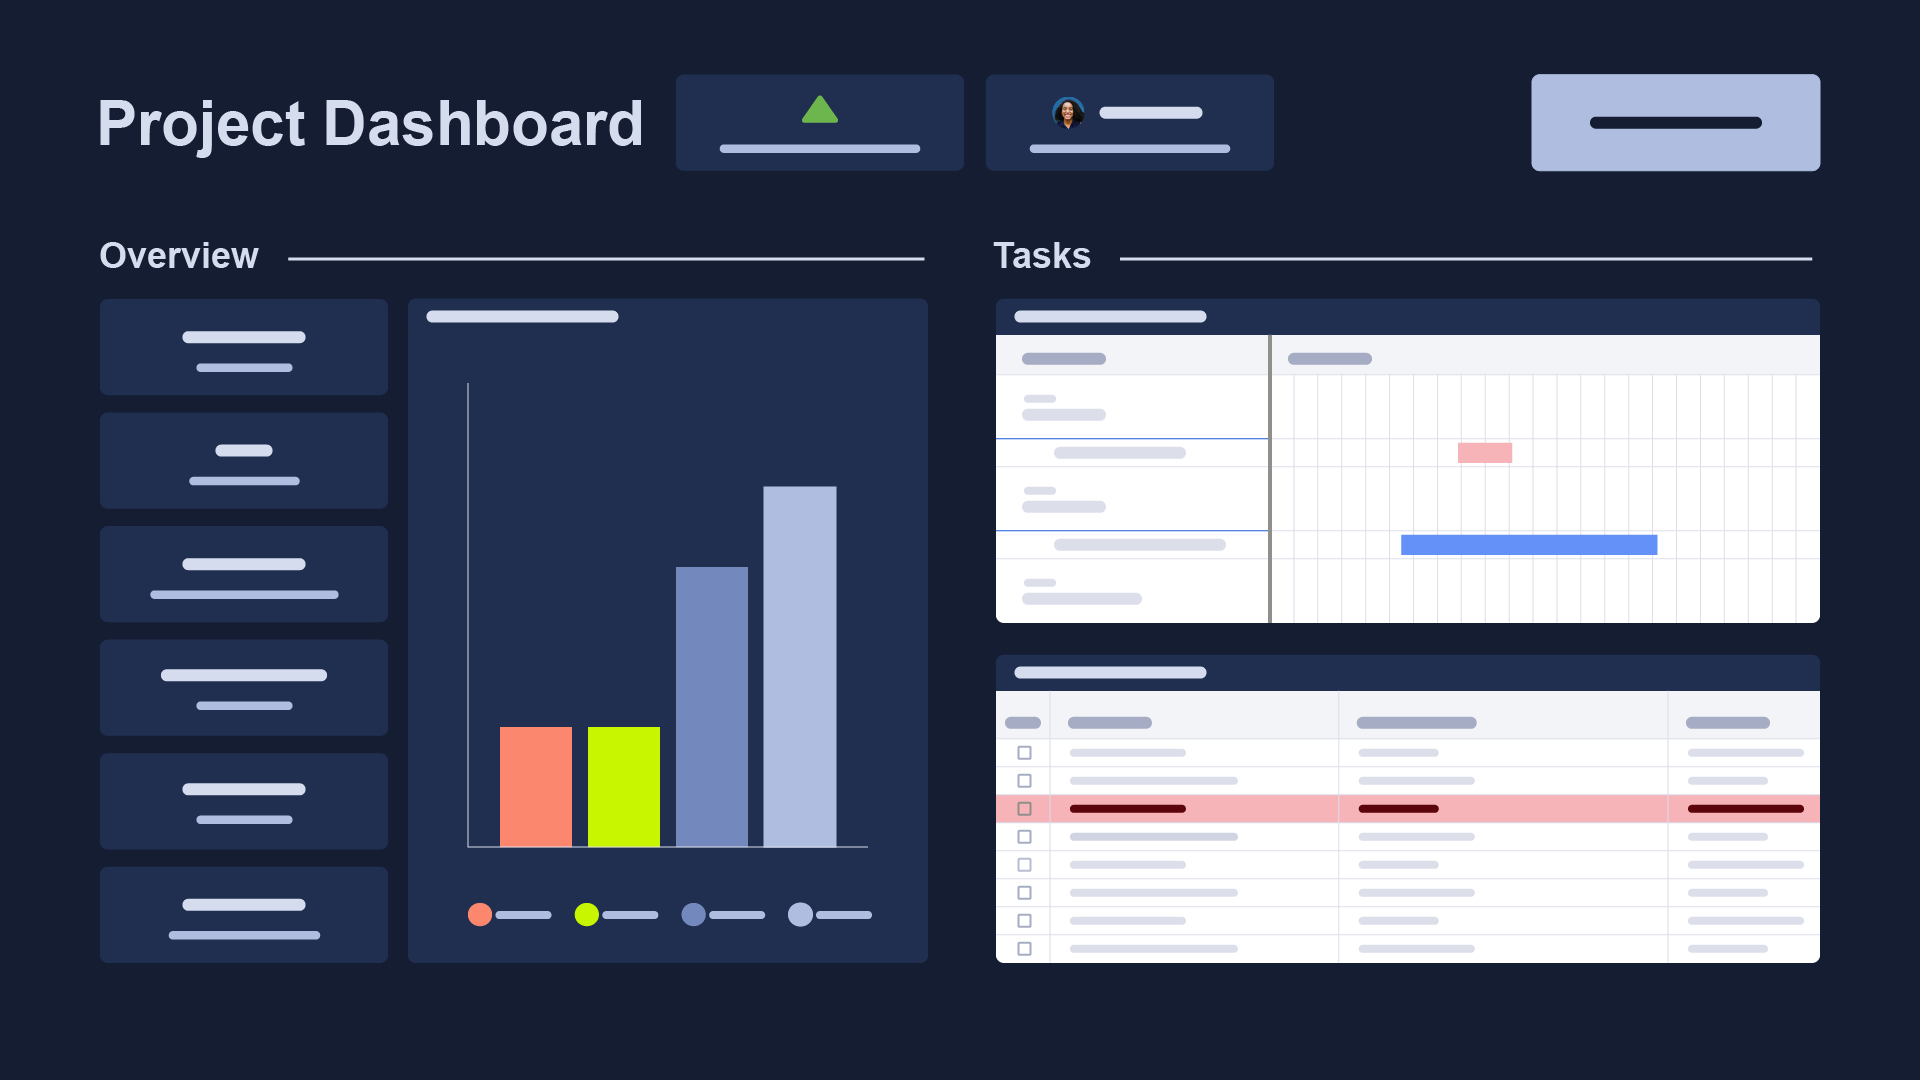
Using Color Incorrectly
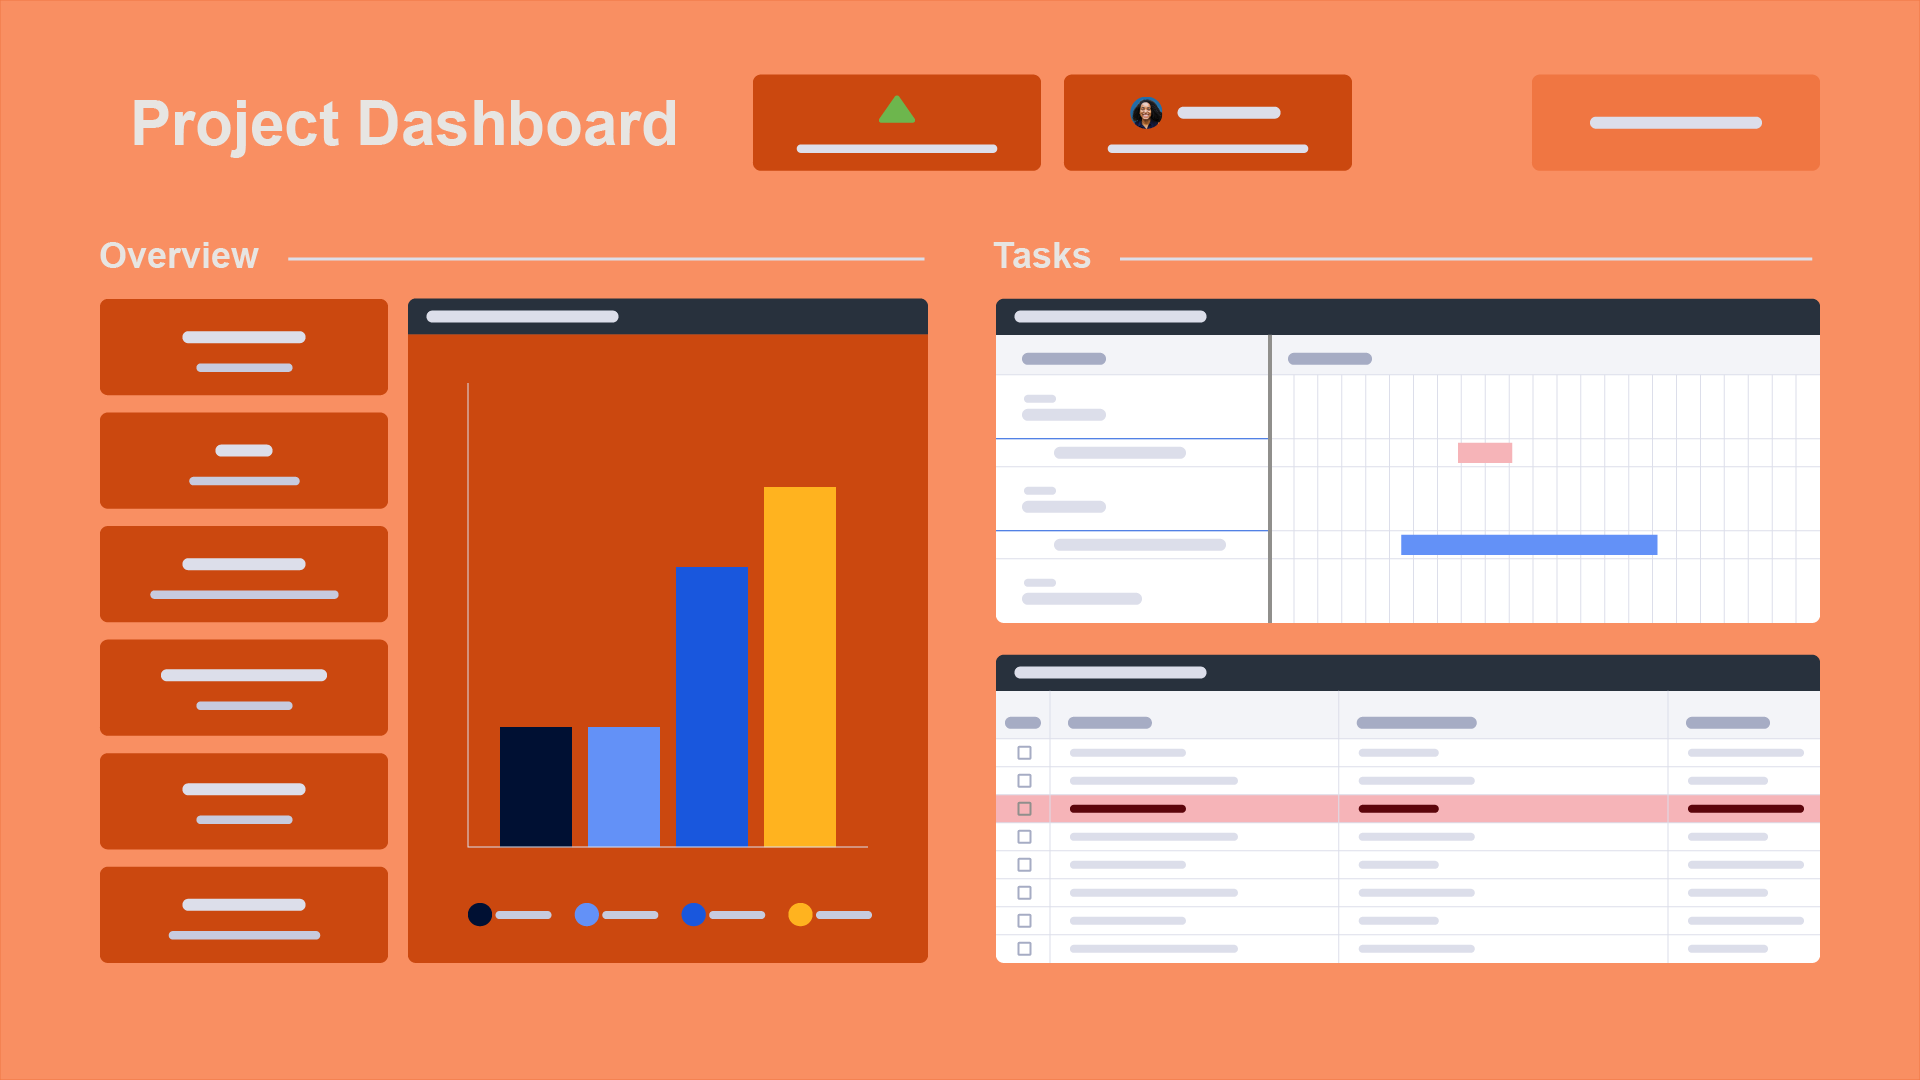
Color is related to layout because it guides your audience’s attention and enhances readability. However, using too many bright colors or ignoring cultural and semantic color meanings can turn your dashboard into a confusing mess. Color is a very powerful tool for engagement—when used right, it makes everything pop; when used wrong, it muddies the waters. Think of color as the guideposts that enhance your layout and lead your audience through the content. Keep it consistent and accessible so everyone can easily get the data they need at a glance. Learn more about strategic color use.
Layout guidelines that will keep you on track
Five-second rule; Not just for food!
When designing your dashboard layout to be effective in just five seconds, focus on these key principles. First, place the most critical information at the top or center, where it naturally draws the viewer’s eye. Use clear, concise labels to ensure readability. Group related metrics together, and utilize visual hierarchy through font sizes and title colors to highlight the most important content on your dashboard. By prioritizing clarity and strategic placement, your dashboard will deliver essential insights at a glance.
Above the fold never gets old
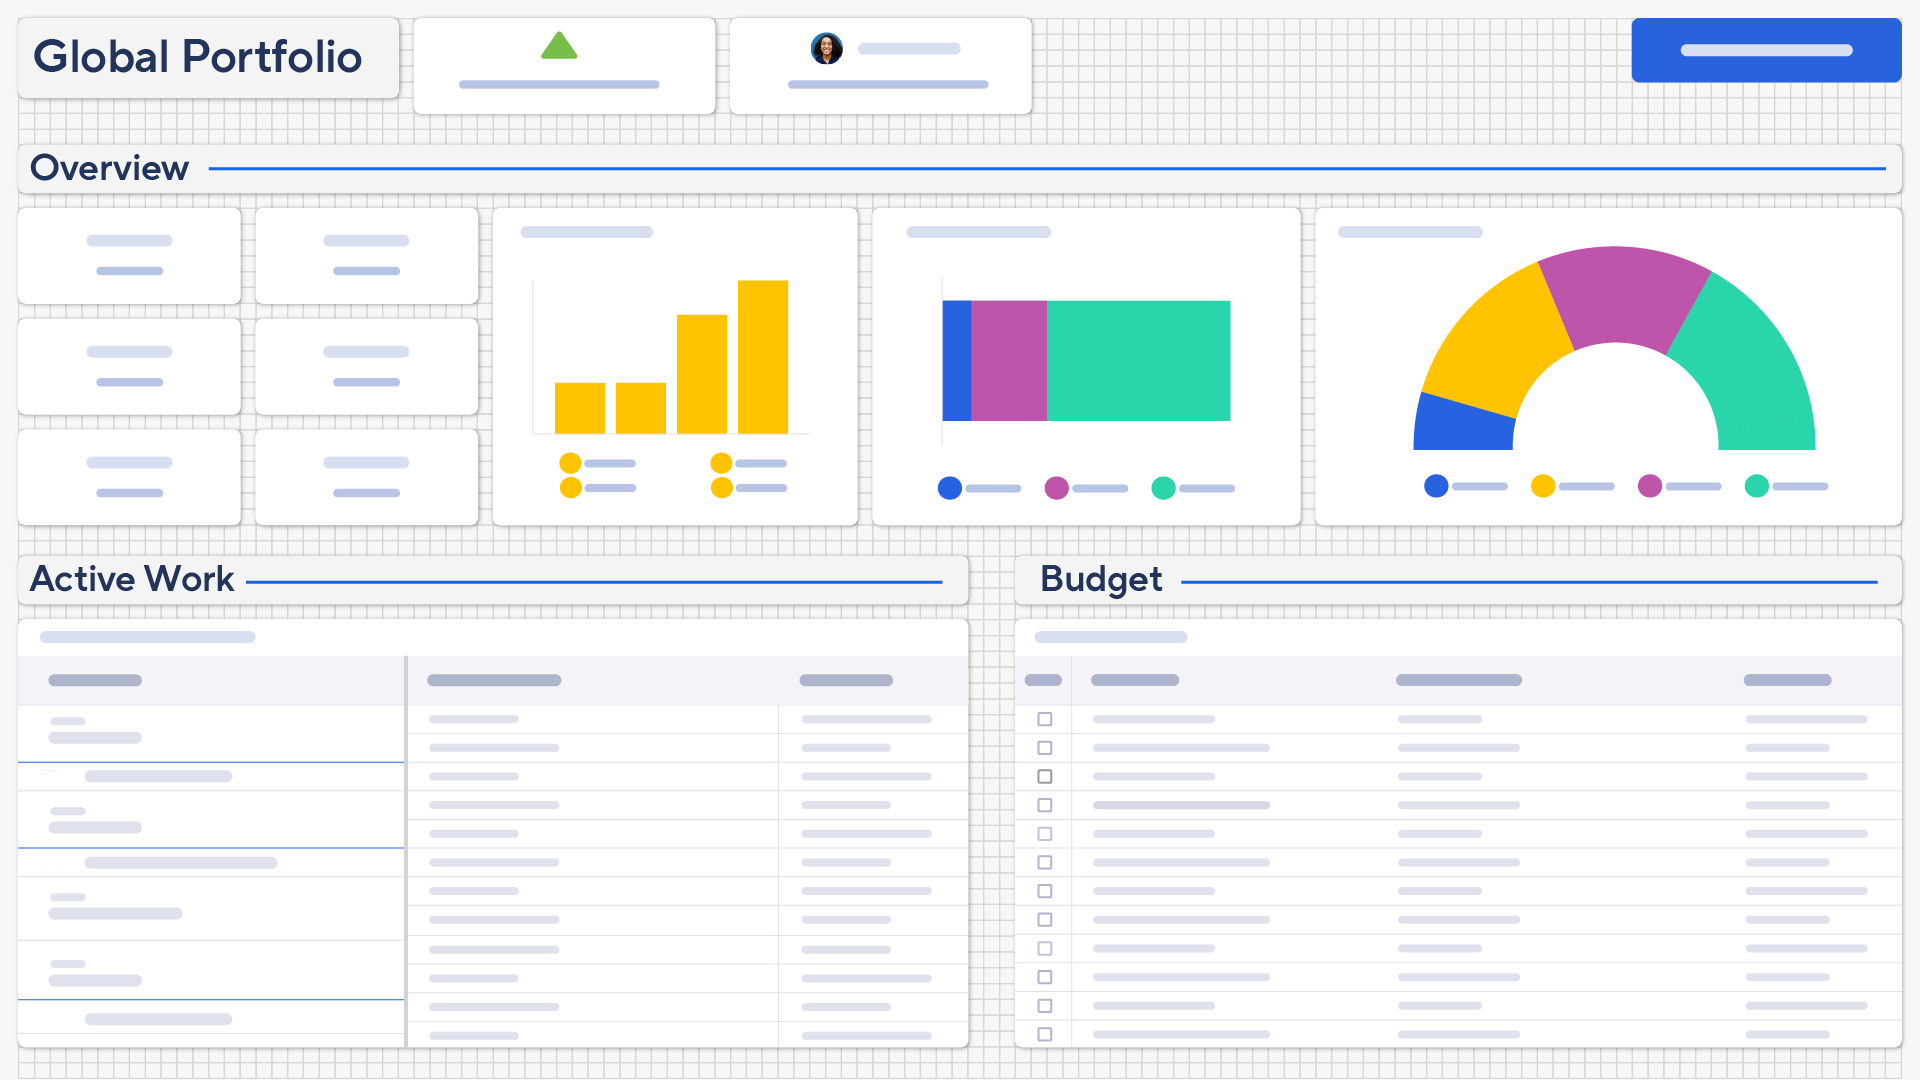
Treat your dashboard like an old newspaper—put the most crucial story front and center, above the fold. As users scroll, allow them to drill down into more detailed information, guiding them through a logical flow from broad insights to specific details.
Start with a high-level overview at the top to give users the 10,000ft view, making key data instantly accessible. This approach ensures your dashboard is both impactful and user-friendly, catering to busy viewers needing quick answers.
Real estate rules apply - location, location, location!
Is your information in the right location for your reader? Placing the wrong content in prime spots can make your dashboard layout less effective. Knowing your audience is also crucial; for example, some cultures read left to right, while other cultures read vertically in columns going from top to bottom and ordered from right to left. If non-critical data occupies the prime areas for your audience, important information may be overlooked, leading to confusion and inefficiency. By strategically positioning your most valuable content in a place that’s aligned with your audience’s reading habits, you’ll ensure your dashboard serves its purpose and delivers maximum value.
I’ve got my sketch, now let’s make it real!
If you sketched your dashboard on paper, start by creating a new dashboard in Smartsheet or opening the existing one you want to transform. For those who used title widgets to draft your design, simply replace each title widget with the actual content.
Adjust it
Tweak anything that doesn’t look right once data and design are in place. As you populate your dashboard with real data, some elements might not align perfectly with your initial sketch. Adjust the layout, resize widgets, and refine color schemes to ensure everything looks cohesive and readable. Pay close attention to spacing, alignment, and consistency to create a polished and professional dashboard that effectively communicates your key insights.
Get feedback
Get feedback from the people you expect to use your dashboard to ensure your dashboard meets their needs. Share your completed dashboard with a select group of end-users and ask for their input on usability and effectiveness. Listen to their suggestions and observe how they interact with the dashboard to identify any pain points or areas for improvement. Incorporating this feedback will help you fine-tune your design, ensuring it is intuitive, user-friendly, and truly serves its purpose.
Refine it
Make necessary refinements to spacing, alignment, and visual balance. Ensure that all elements are evenly spaced to avoid clutter and enhance readability. Align widgets consistently to create a clean, organized look. Pay attention to visual balance by distributing content evenly across the dashboard, so no area appears overcrowded or sparse. These adjustments will help create a polished, professional dashboard that is both aesthetically pleasing and easy to navigate.
So, to recap!
Determine your dashboard's purpose. Be aware of common mistakes. Sketch your dashboard. Plug real content in. Adjust, get feedback and never stop refining.
Now you’ve got everything you need to layout your dashboard like a pro! Until next time, keep designing, innovating, and letting your dashboards speak for themselves!


