What Is an Agile Workflow Diagram?
An Agile workflow diagram is a visual tool that shows processes using Agile methodology. They typically look like flowcharts and display key process workflow stages such as planning, iteration, and testing. Use them to develop, communicate, and document iterative processes.
An Agile workflow diagram often includes steps and feedback loops within the process. You can also create an Agile workflow diagram that shows multiple processes at once.
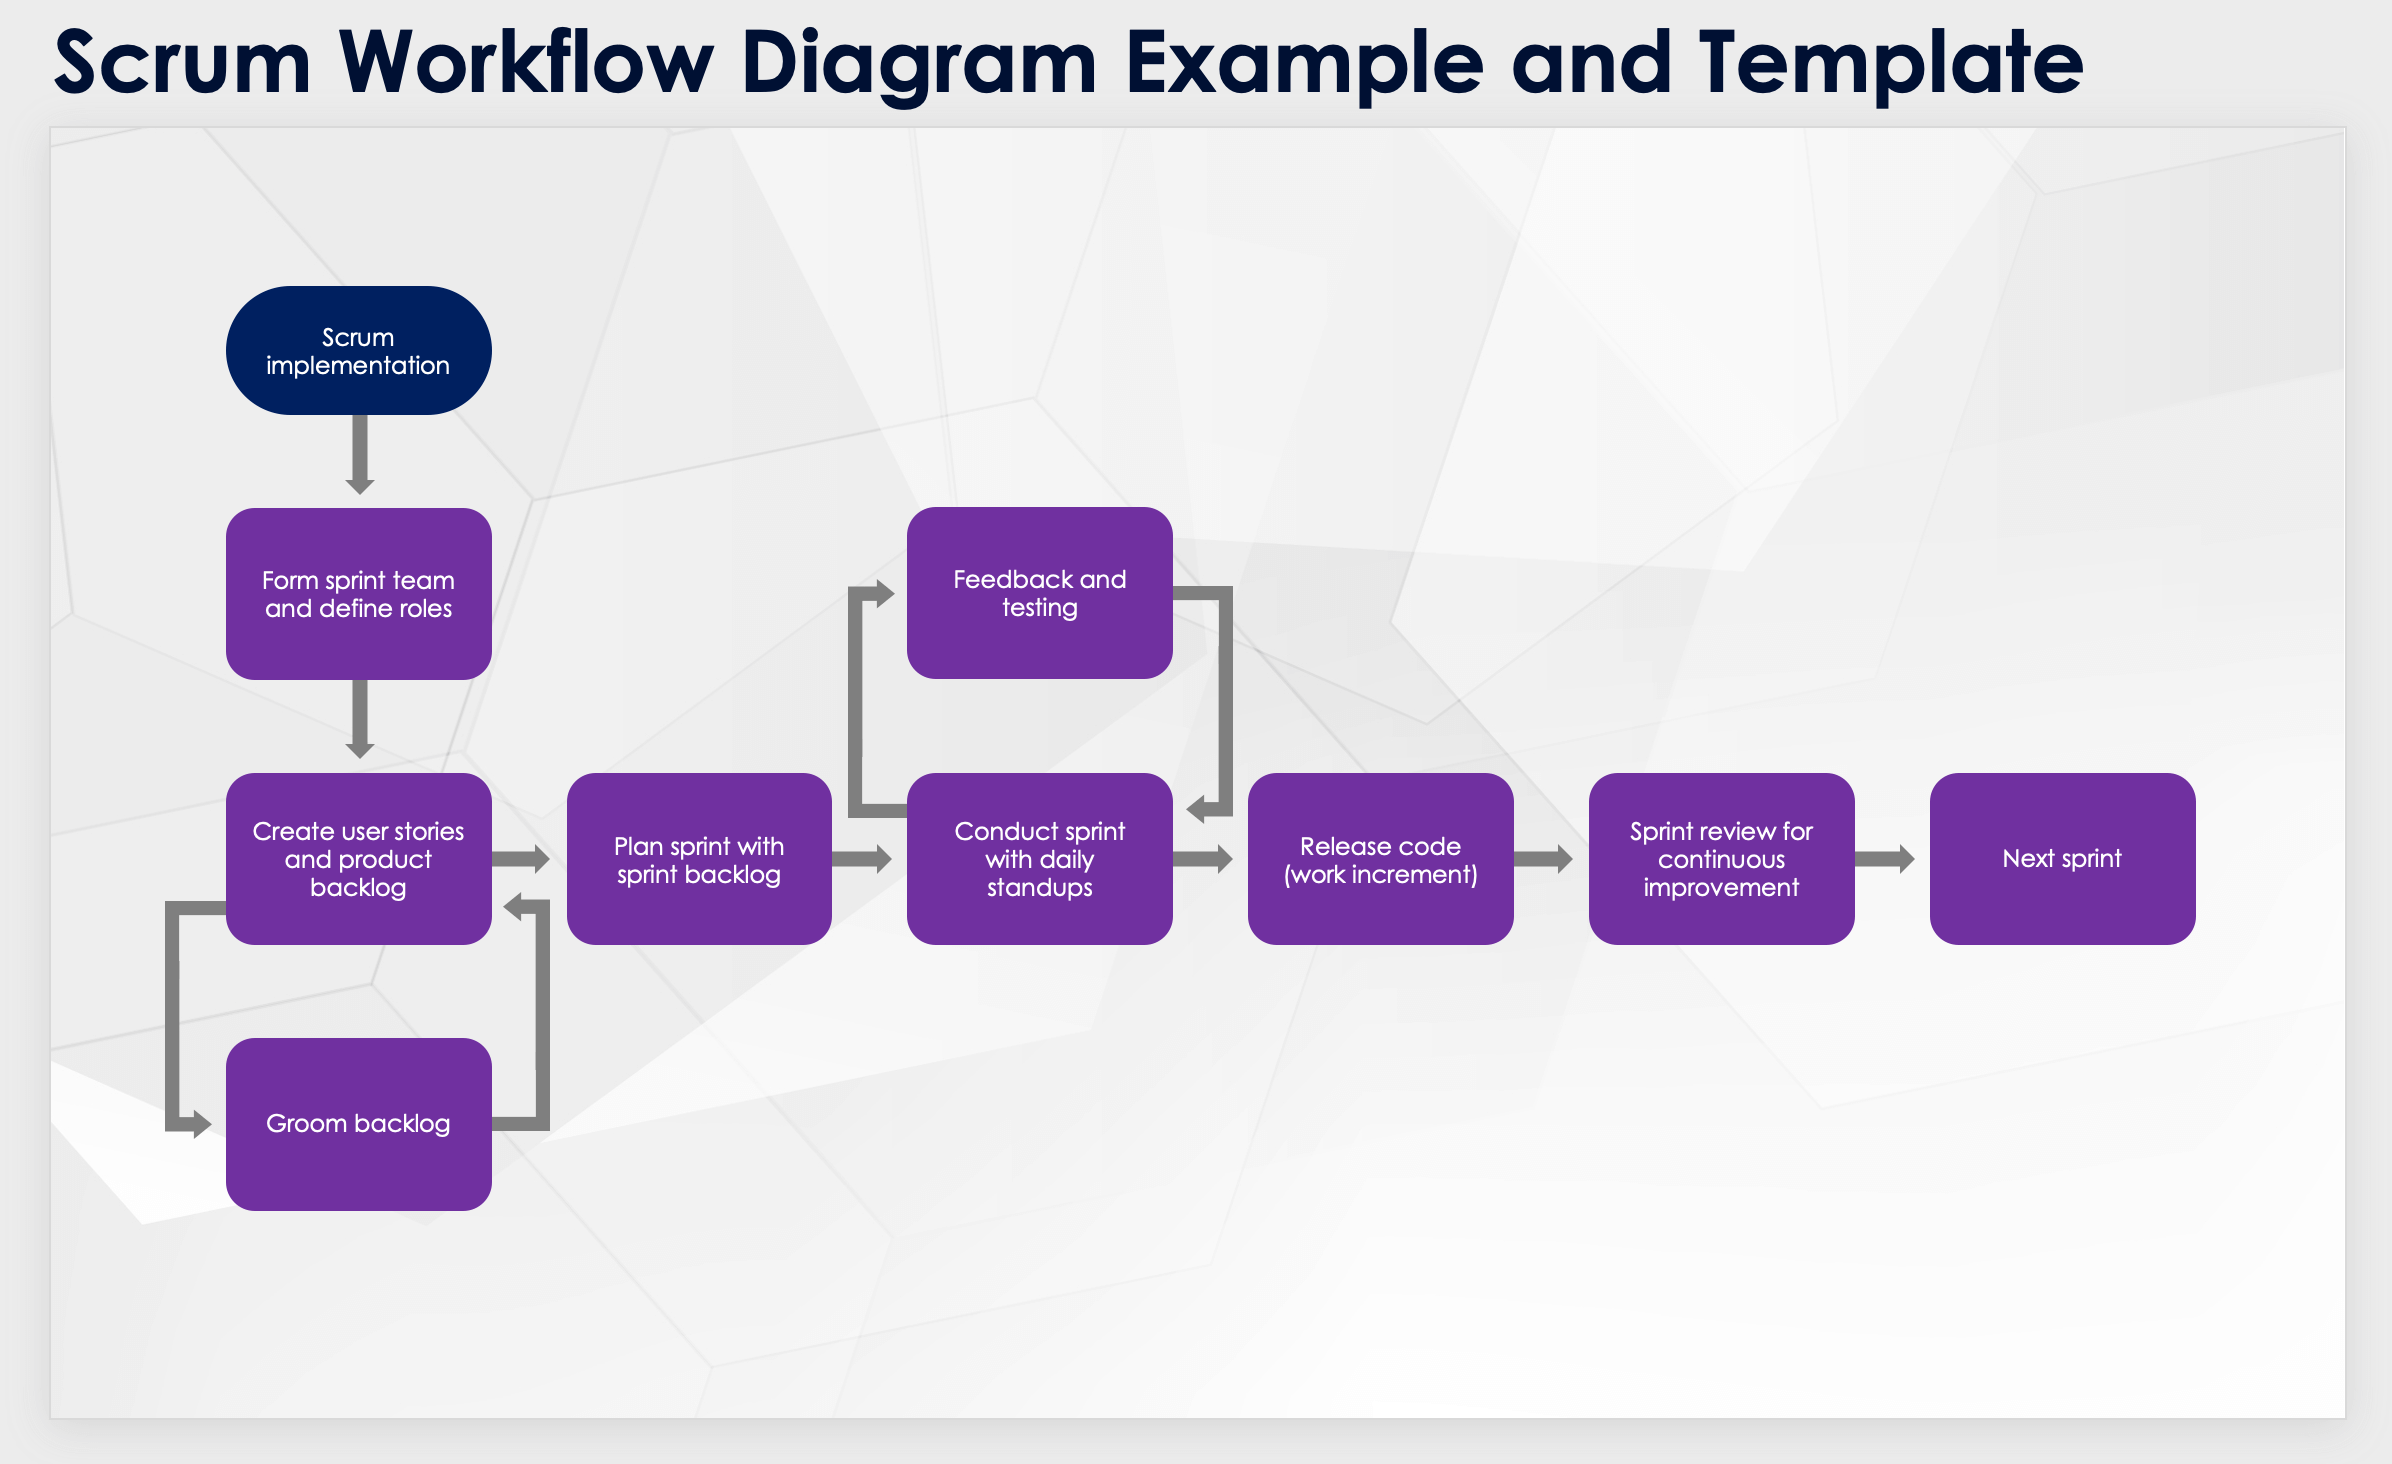
Here is an example of a generic Agile project flowchart:
How Are Agile Workflow Diagrams Used?
Companies use Agile workflow diagrams to define or improve steps in an iterative process workflow. You can also use the diagrams to facilitate thinking as you define or refine a process, or as a communication tool to explain and document the process.
Here’s a detailed list of how teams use Agile workflow diagrams:
- Process Design and Standardization: Agile workflow diagrams help design and standardize workflows, ensuring that you adhere to best practices. By establishing a clear process, teams can easily adopt and implement Agile project management workflows, which leads to more predictable, reliable outcomes.
- Process Improvement: The diagrams can help you identify areas of the workflow that can be optimized for greater efficiency and effectiveness. By continuously analyzing and refining the workflow, teams can eliminate bottlenecks and streamline operations, which ultimately saves time and resources.
- Planning and Strategy: You can also use the diagrams to plan and strategize project activities, as they provide a high-level view of the workflow. This comprehensive overview helps decision-makers allocate resources more effectively and plan for future project phases.
- Documenting Processes: Because the diagrams clearly document the workflow, they can help teams maintain consistency. They ensure all team members and stakeholders understand the process, which improves collaboration and efficiency.
- Training and Onboarding: The diagrams serve as training tools for new team members, as they help the team understand the workflow and their roles within it. These diagrams can help new members integrate smoothly into the team and become productive.
- Communication With Stakeholders: Agile workflow diagrams communicate the workflow to stakeholders, including clients, management, and other departments. This transparency fosters trust and helps everyone understand the process and its goals.
- Audit and Compliance: The diagrams help maintain workflow records for audit and compliance purposes. By providing a clear record, organizations can demonstrate adherence to standards and regulations, which reduces the risk of noncompliance.
- Risk Management: Use the diagrams to identify potential risks within the workflow and plan mitigation strategies. By proactively addressing these risks, teams can prevent issues and ensure smoother project execution.
- Setting Expectations: The diagrams clearly define the stages and expectations for each phase of the workflow. By setting clear expectations, teams can align their efforts and ensure everyone knows what to expect at each stage.
Real-World Examples of How Agile Workflow Diagrams Are Used
Here are several examples of how organizations have used Agile methodology diagrams to improve their processes with Agile thinking.

George Yang, Founder and Chief Product Designer at YR Fitness, describes how his team recently redesigned their product development workflow to be more Agile.
“Agile workflow diagrams helped us a lot in this effort,” Yang says. “First of all, we mapped out our current process and identified a number of bottlenecks and inefficiencies that retarded our time to market. It meant that by seeing the entire journey — from concept to production — one could easily see at which point delays were occurring or where the handoffs between teams were not as smooth as they could be. These diagrams served not only to iron out the process but also played a key role in securing executive support. It was easier to convince leadership of the tangible benefits by drawing a clear, vivid picture of how the new Agile workflow would improve efficiency.”

Rasa Urbonaite, the CMO at Breezit, recently used an Agile workflow diagram to improve the development process at her California-based wedding and event organization.
“We produced a flowchart that described every stage in detail, from obtaining requirements to testing and implementation. The staff was better able to comprehend their duties thanks to this picture, which also showed us where we might increase productivity,” she says. “We completed the task faster by referring to the diagram. It made it simpler to explain our procedure to managers and new team members, which enhanced communication inside the organization.”
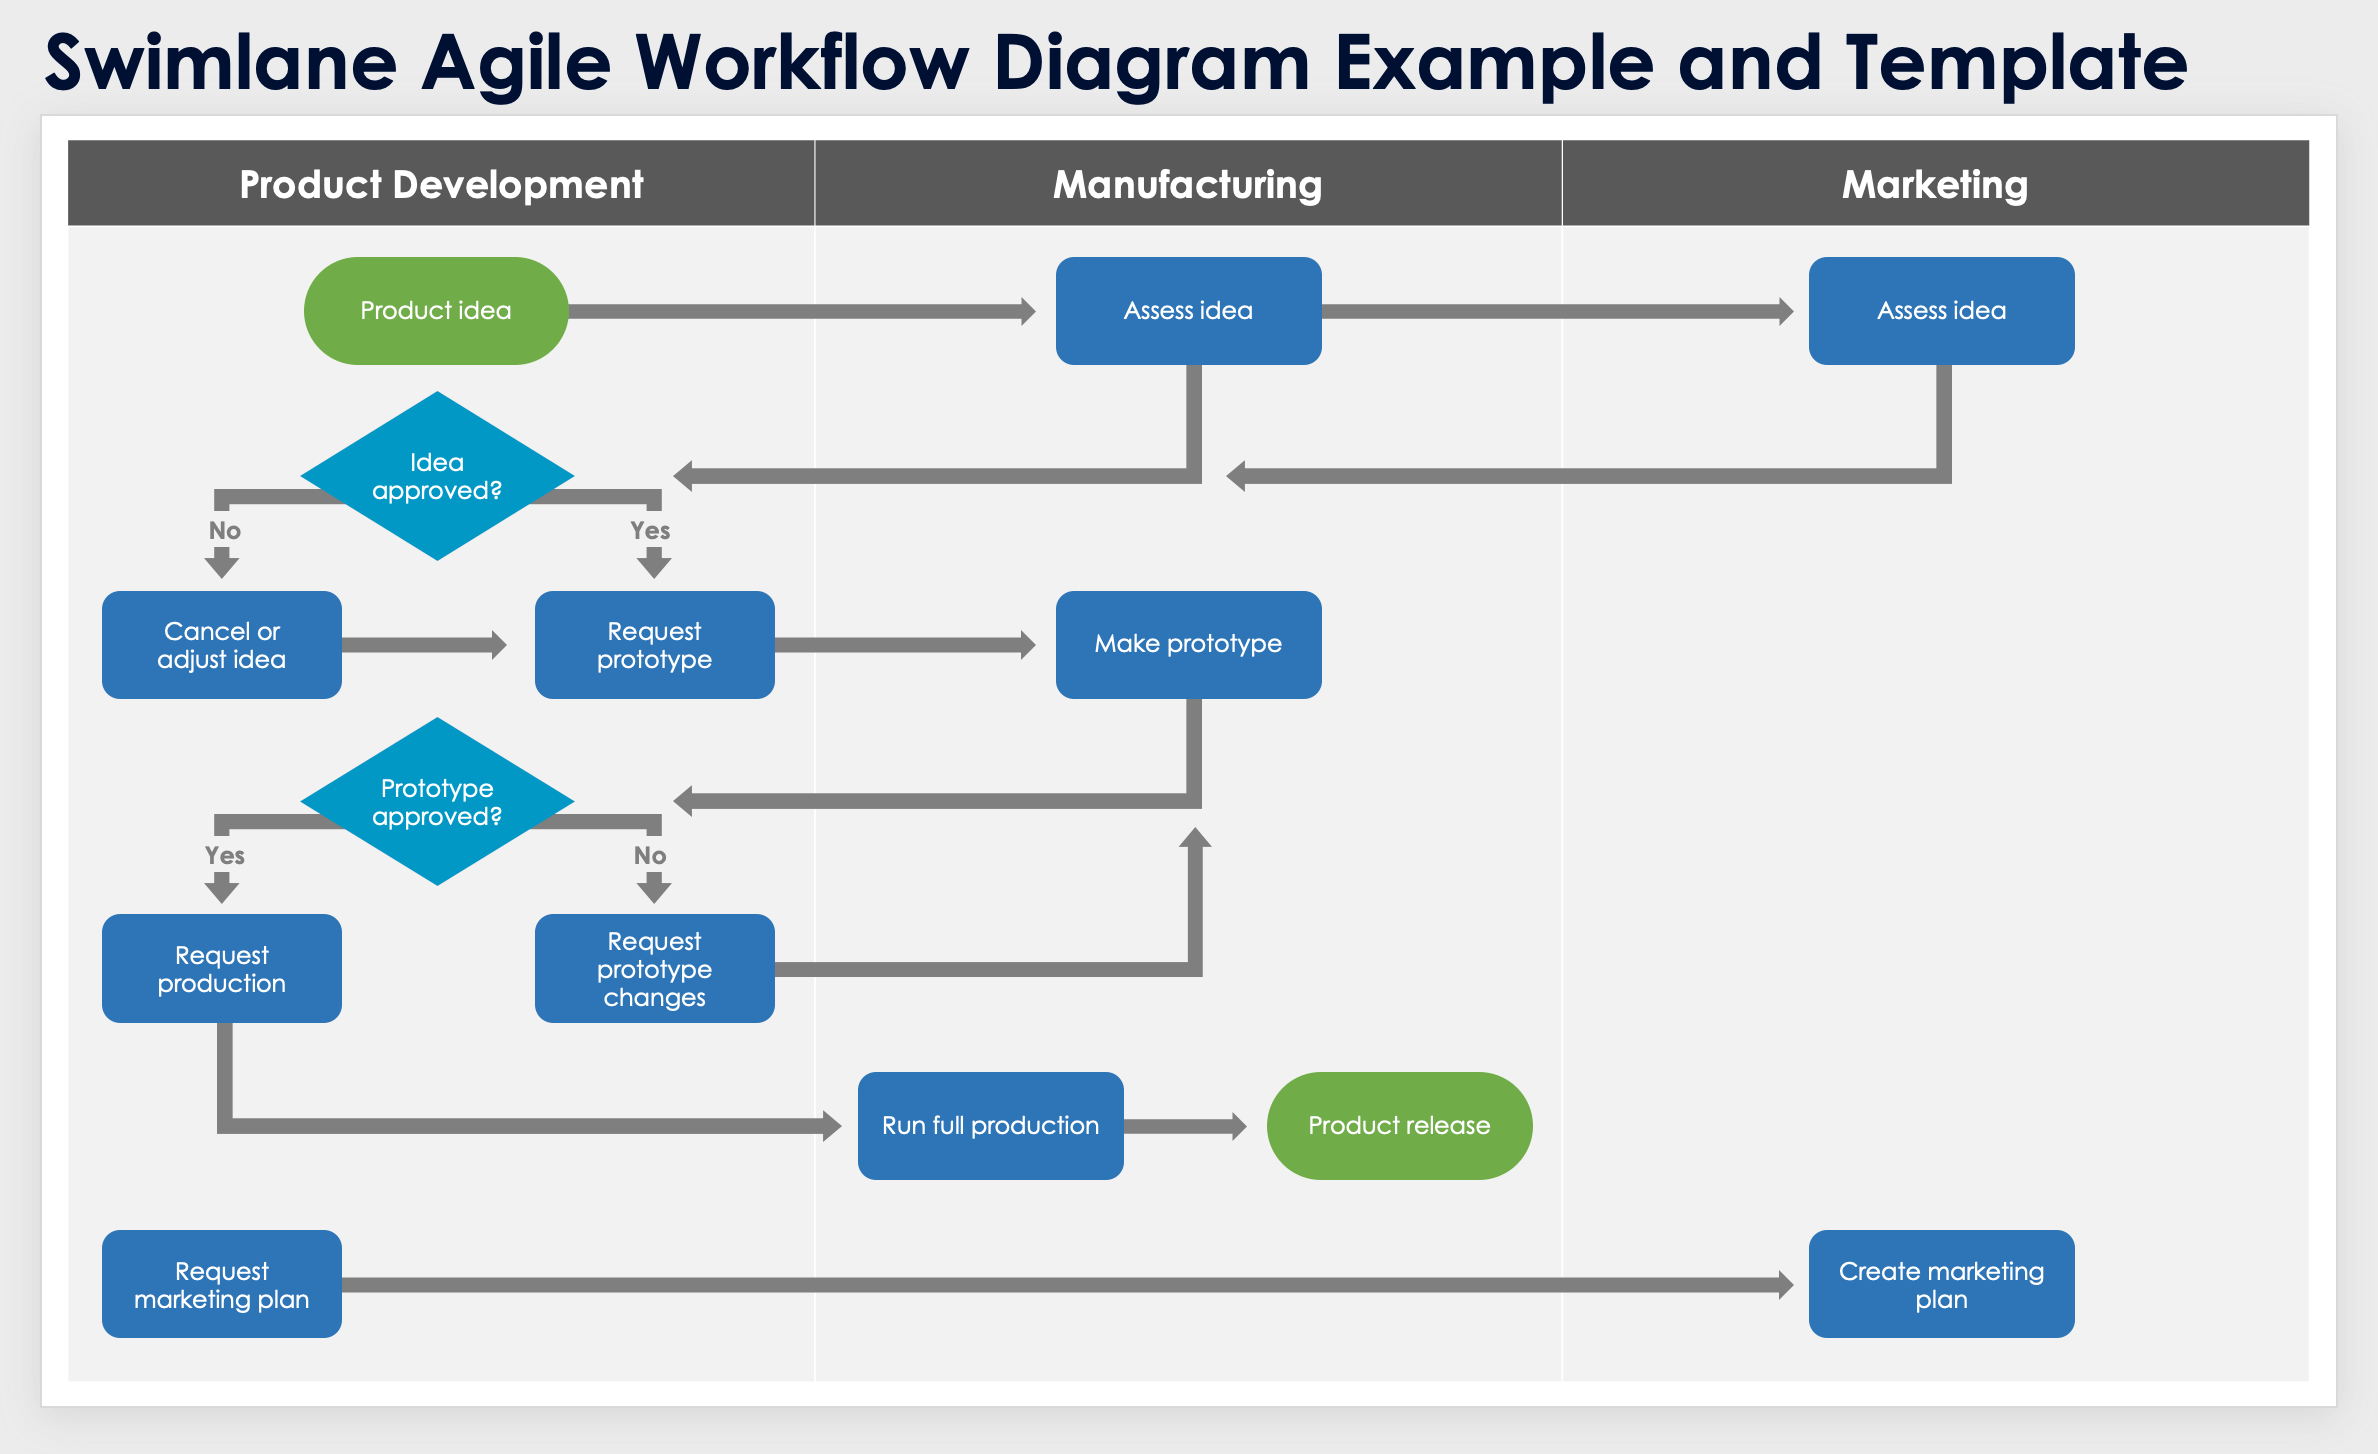
A 2021 research paper, "Streamlined Workflow Analysis Using Swim Lanes," describes how the University at Albany, SUNY, used Agile methodology diagrams while migrating from a legacy library system to a new platform. Using swimlane diagrams, the team sequenced tasks and identified who was responsible for each.
The author writes: "The streamlined workflow analysis process presented here represents a bottom-up approach, where staff at all levels actively participated in the collection of data by brainstorming tasks for each workflow within their responsibility.” That approach, the author continues, “results in relatively easy-to-maintain swimlane diagrams."
For anyone interested in using Agile workflow diagrams, Yang of YR Fitness advises making them as clear as possible for non-Agile people.
“We have found out that using standard symbols and a clean, organized plot does the job of making these diagrams understandable for all the parties involved,” Yang says. “Further, one can also add brief annotations or notes wherever required to capture the notes between steps, making any complicated step or decisions in the workflow clear to all stakeholders.”
Standard shapes for a process flow diagram include rectangles for steps, diamonds for decision points, and yes-and-no branches based on the decision.
Yang adds: “An Agile workflow diagram needs constant updating and relevance. Workflows in Agile are dynamic, and with new processes evolving, the diagrams must be revised to stay effective. These diagrams stay relevant and will continue to provide value, with regular reviews and updating. We revisit our Agile workflow diagrams at the end of each sprint, editing them based on the feedback from our team or the actual outcome of that sprint.”
Types of Agile Workflow Diagrams
The three main types of Agile workflow diagrams are flowcharts and process maps, which use shapes and arrows to designate steps, handoffs, decisions, and feedback loops, and swimlane diagrams, which show areas of responsibility in different lanes.
Other types of Agile workflow diagrams include value stream maps, cumulative flow diagrams, and TFS diagrams.
Learn more about the common types of Agile workflow diagrams below:
- Flowcharts: Flowcharts represent the steps in a process using symbols and arrows. Teams use flowcharts to document the sequence of activities in a workflow to provide a clear and concise overview of the process. Common uses include outlining Agile software development, creating Agile processes and product workflows in numerous other fields, and optimizing Agile workflows.
- Process Maps: Process maps, including business process maps, visually represent the end-to-end process. They show how tasks flow from one stage to another and help teams identify roles, responsibilities, and interactions between different parts of the process, to ensure a smooth workflow.
- Swimlane Diagrams: Swimlane diagrams divide the workflow into swimlanes. Each lane represents a different team or role. By clarifying responsibilities and handoffs between teams or individuals, these diagrams help prevent miscommunications and delays.
- Value Stream Maps: Value stream maps visualize the flow of materials and information throughout the production process. They help identify value-added and non-value-added activities, which enables teams to streamline the process and eliminate waste.
- Cumulative Flow Diagram: A cumulative flow diagram (CFD) is a visual tool used in Agile project management, particularly in Kanban and Scrum frameworks. Teams use CFDs to track the progress of work across different stages of a workflow over time, and to monitor project flow and identify bottlenecks by showing the work items in various states (e.g., To Do, In Progress, Done) on a single chart. A Scaled Cumulative Flow Diagram (Scaled CFD) is an advanced version of a standard CFD, often used in larger, scaled Agile frameworks such as Scaled Agile Framework (SAFe). The main difference lies in how organizations apply it across multiple teams.
- TFS diagrams: Teams create these using Microsoft's Team Foundation Server (TFS), now integrated into Azure DevOps, to manage and track the progress of Agile projects. These diagrams help teams visualize workflows, track work items (such as user stories, tasks, and bugs), and monitor a project's progress.
Here’s a selection of Agile project management templates in Excel to help put a workflow into action. For actual Agile workflow diagram templates in PowerPoint and Google Slides, see the next section.
Agile Workflow Diagram Examples and Templates
The key features of Agile workflow diagrams are feedback loops and iteration. In contrast, a traditional Waterfall workflow is more sequential, and only includes feedback upon completion.
Below, you’ll find three Agile workflow diagram examples and free, downloadable templates.
Swimlane Agile Workflow Diagram Example and Template
This Agile workflow diagram incorporates swimlanes, which define areas of responsibility. This example shows the interplay of three departments, each with a vertical swimlane, working together on a product from ideation to release. You can download the blank template to create your own Agile swimlane diagram.

Download a Swimlane Agile Workflow Diagram Template for
PowerPoint
| Google Slides
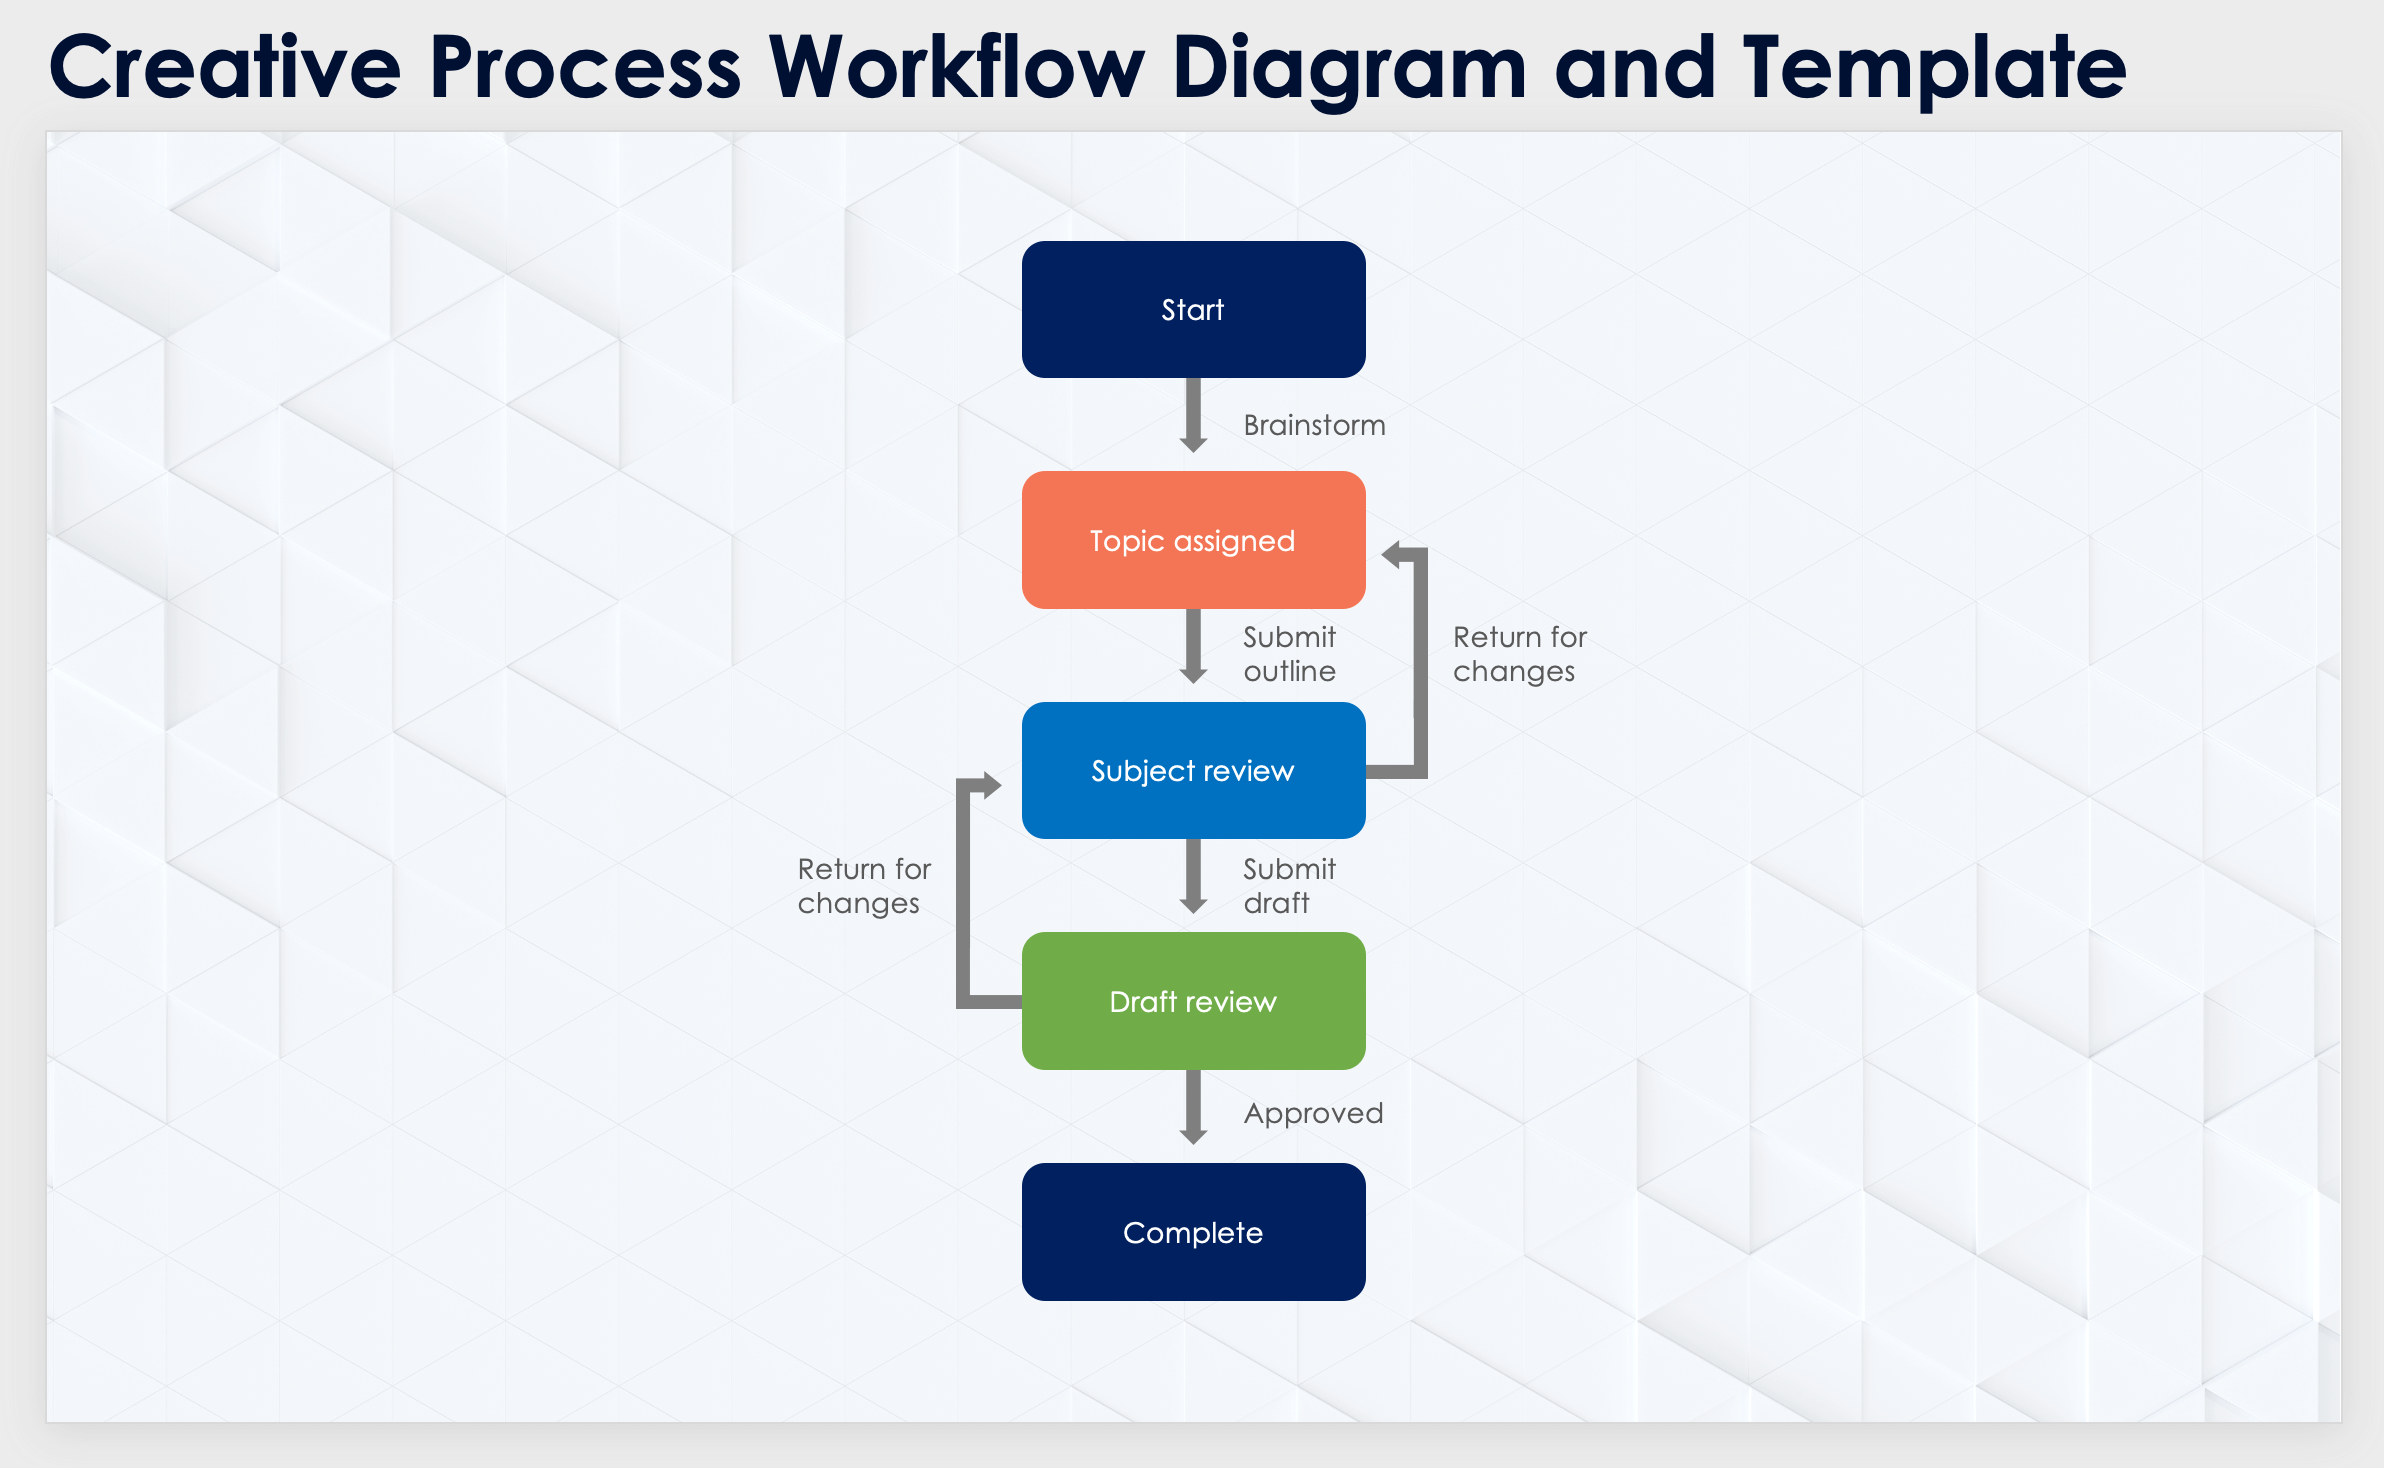
Creative Process Workflow Diagram and Template
Creative processes are often naturally Agile since they continue feedback loops, iterations, and approvals. Here’s an example of a simplified Agile workflow diagram for an article or other written content.

Download a Creative Process Workflow Diagram Template for
PowerPoint
| Google Slides
Improve Agile Workflow Efficiency with Real-Time Work Management in Smartsheet
Empower your people to go above and beyond with a flexible platform designed to match the needs of your team — and adapt as those needs change.
The Smartsheet platform makes it easy to plan, capture, manage, and report on work from anywhere, helping your team be more effective and get more done. Report on key metrics and get real-time visibility into work as it happens with roll-up reports, dashboards, and automated workflows built to keep your team connected and informed.
When teams have clarity into the work getting done, there’s no telling how much more they can accomplish in the same amount of time. Try Smartsheet for free, today.
Improve Task Visibility with Board View in Smartsheet
It’s easy for tasks to get lost in the madness of your everyday work. What you need is a better, more visual way to track and manage tasks.
Empower your team with board view in Smartsheet — a user-friendly task tracking solution that ensures seamless task prioritization, enhanced project visibility, and effortless agile collaboration.
Whether managing projects, optimizing workloads, or tracking to-dos, board view helps eliminate unnecessary status meetings by letting team members track project progress, completed tasks, and upcoming work with task cards.
Discover the intuitive drag-and-drop cards, real-time collaboration, and organizational card nesting that drive your organization to adapt and deliver more effectively.
Learn more about board view in Smartsheet.
