Grafana Connector
By CanSolveIt
Visualize and display on dashboards Smartsheet data using various Grafana widget solutions. Grafana widgets have customizable features that make a difference and can level up dashboard efficiency for you and your team.
New types of visualizations for your dashboard
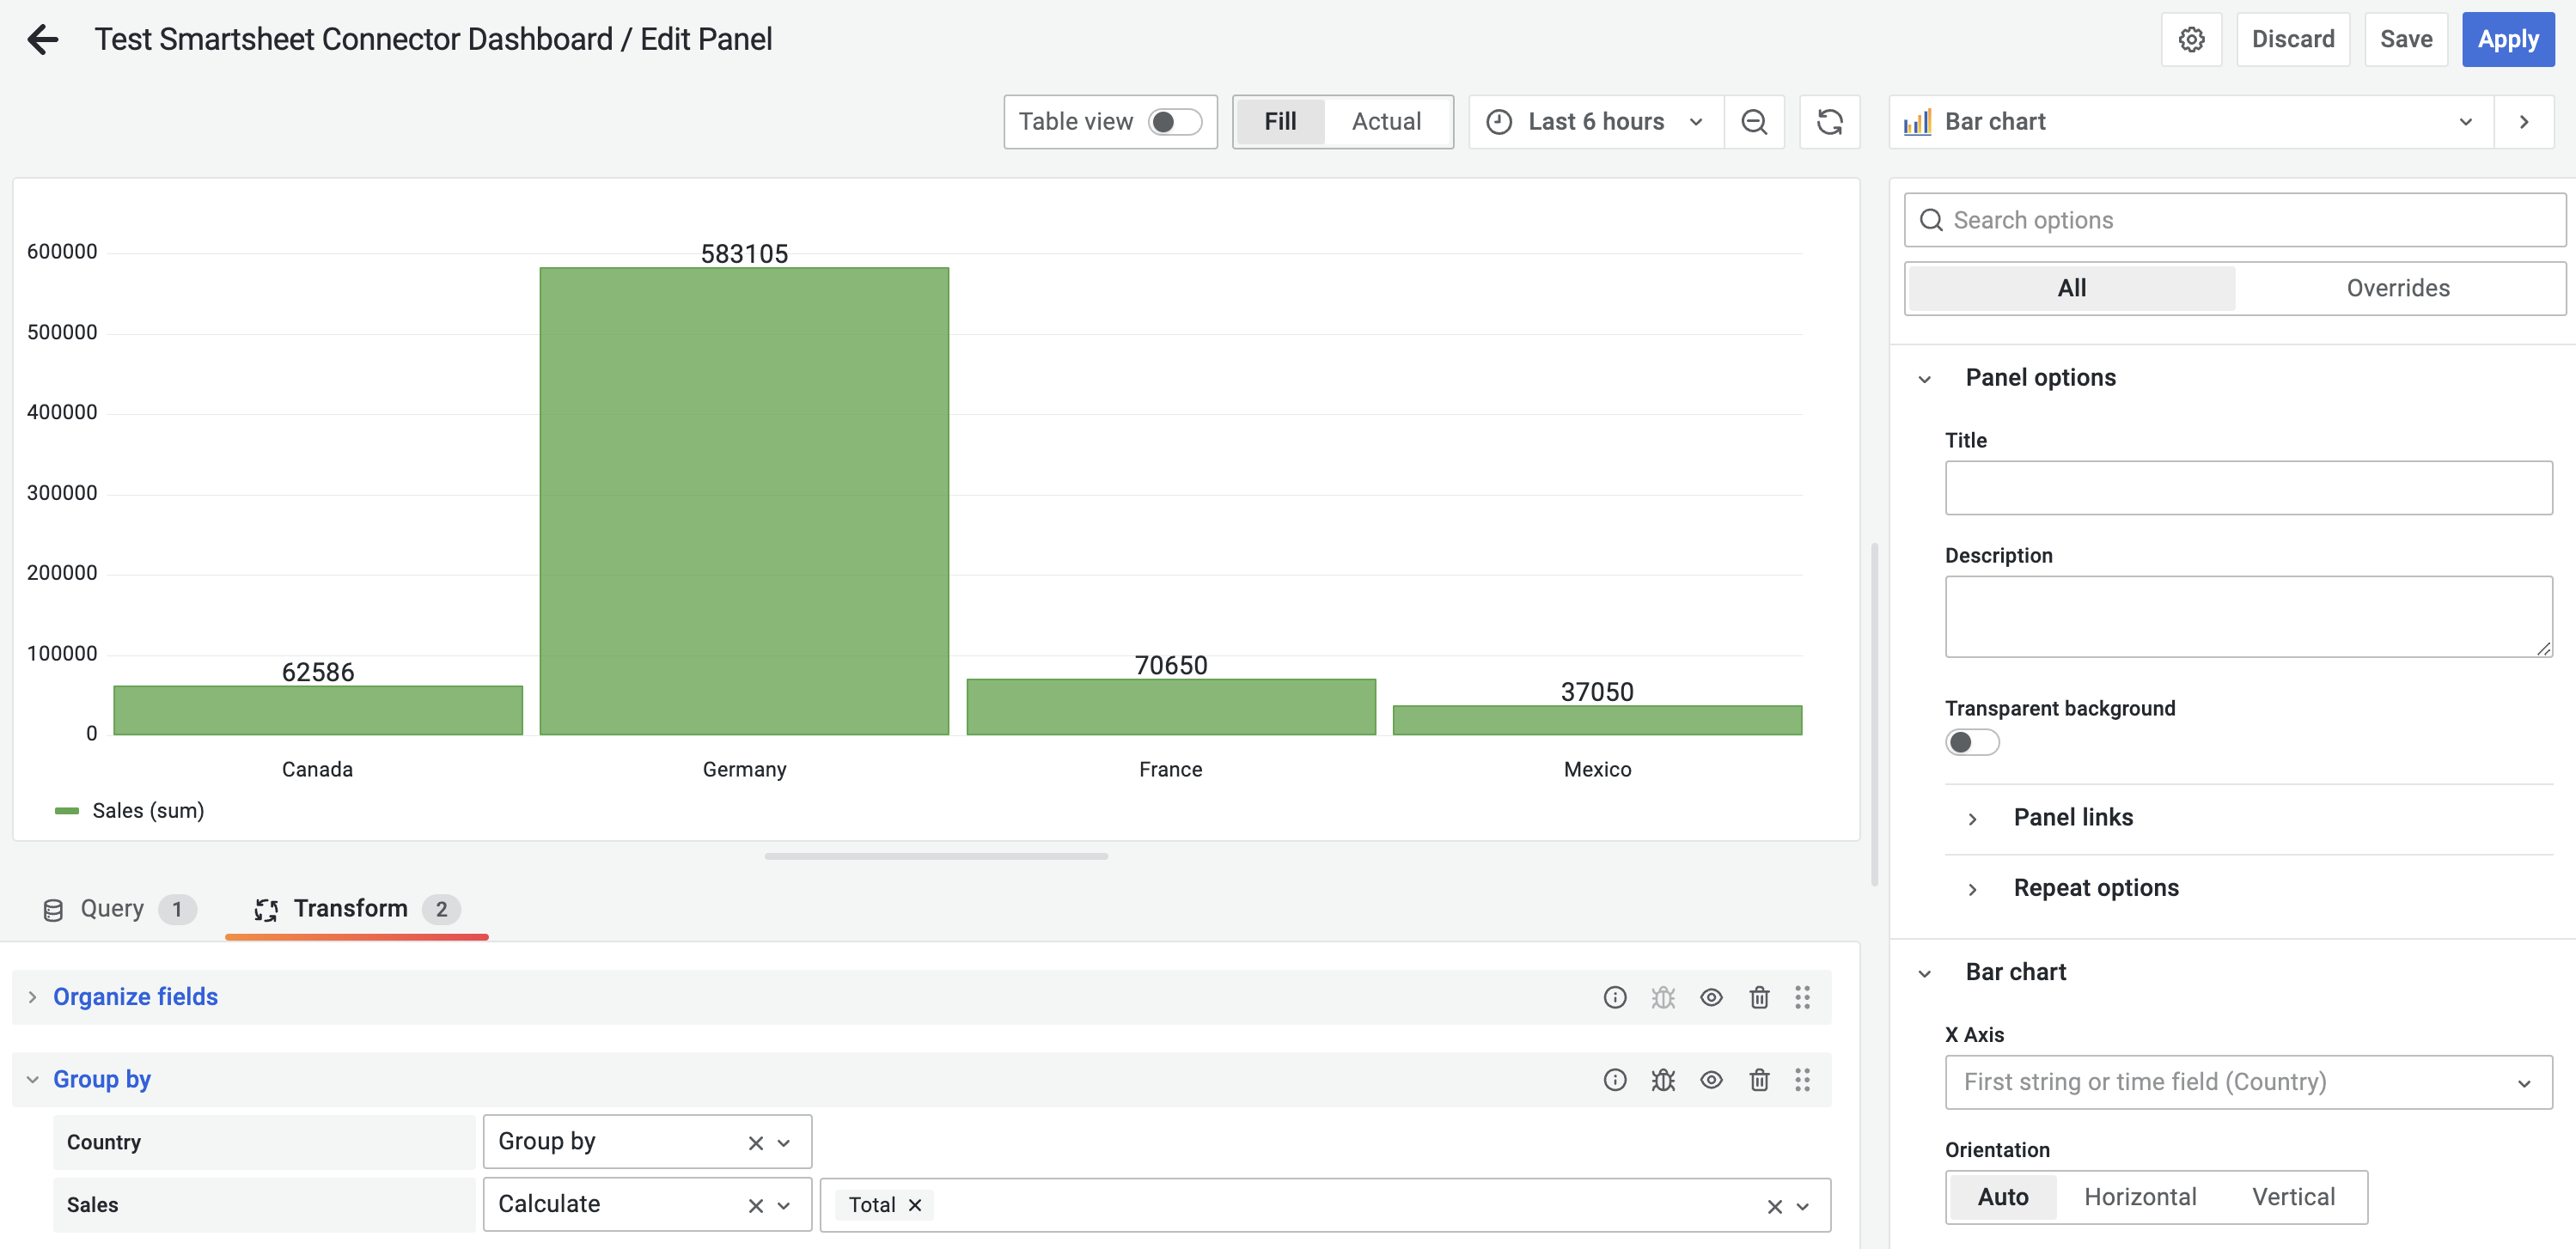
Use Grafana's functionality to visualize your data through a variety of widgets. Customization and data transformation features allow connecting you and your teams with critical at a glance information that is relevant to your business operations. Also, with Grafana Connector you do not need to define column types because data auto-type defining has been embedded into this plugin.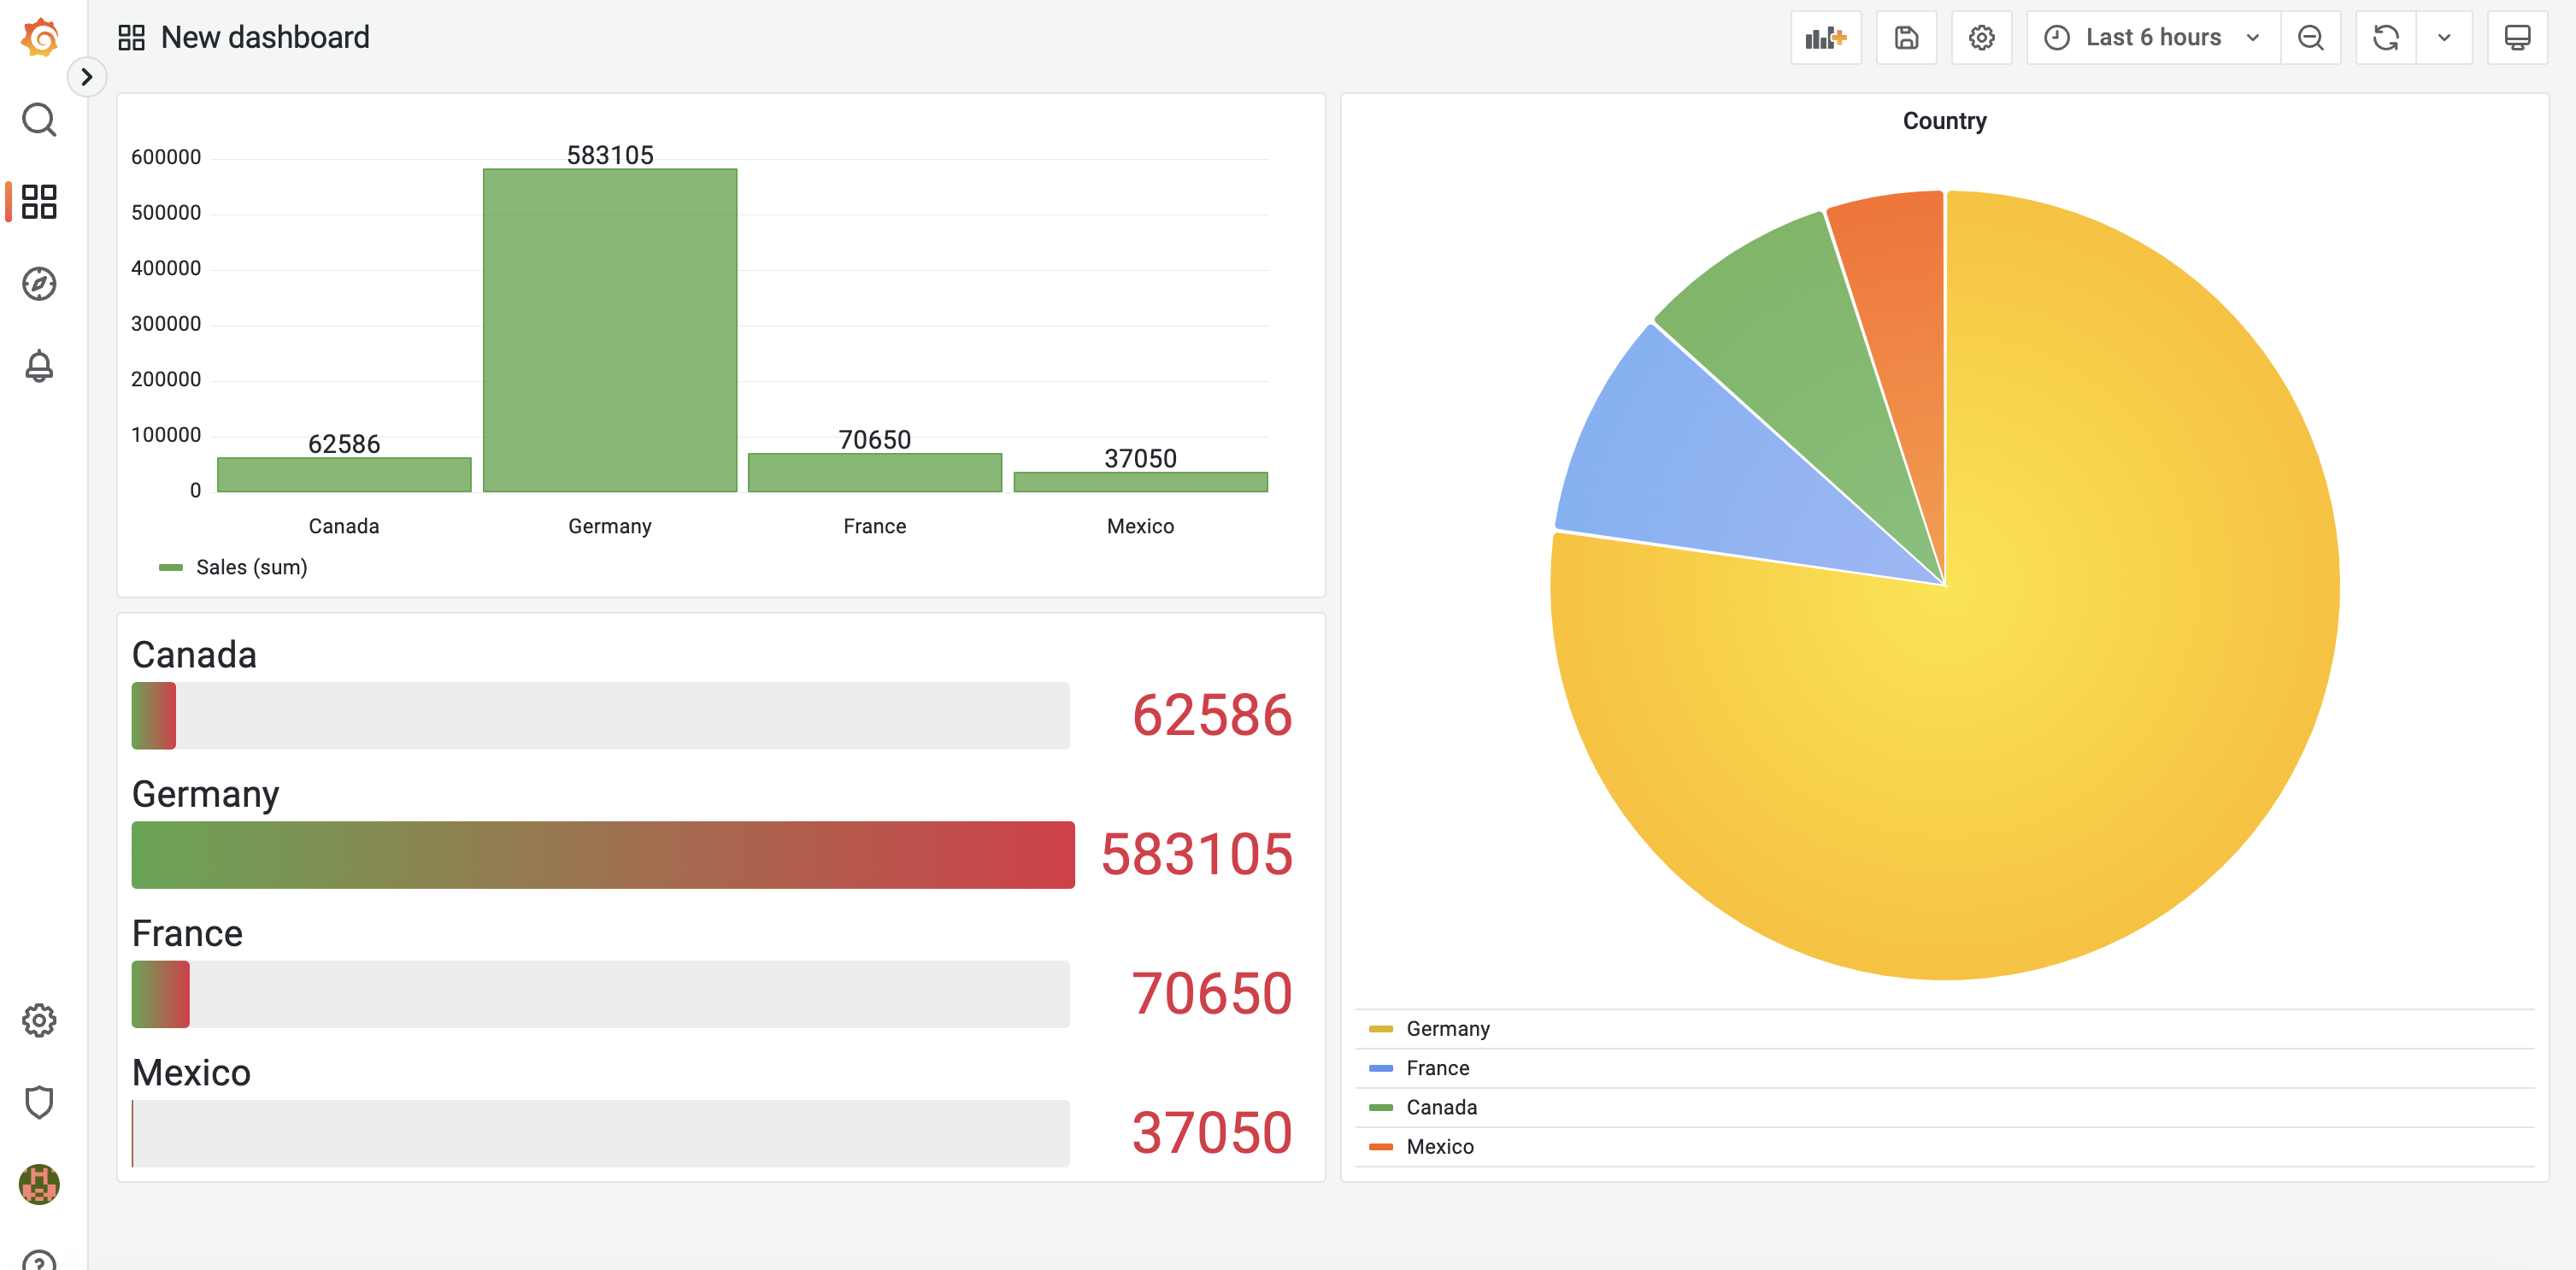
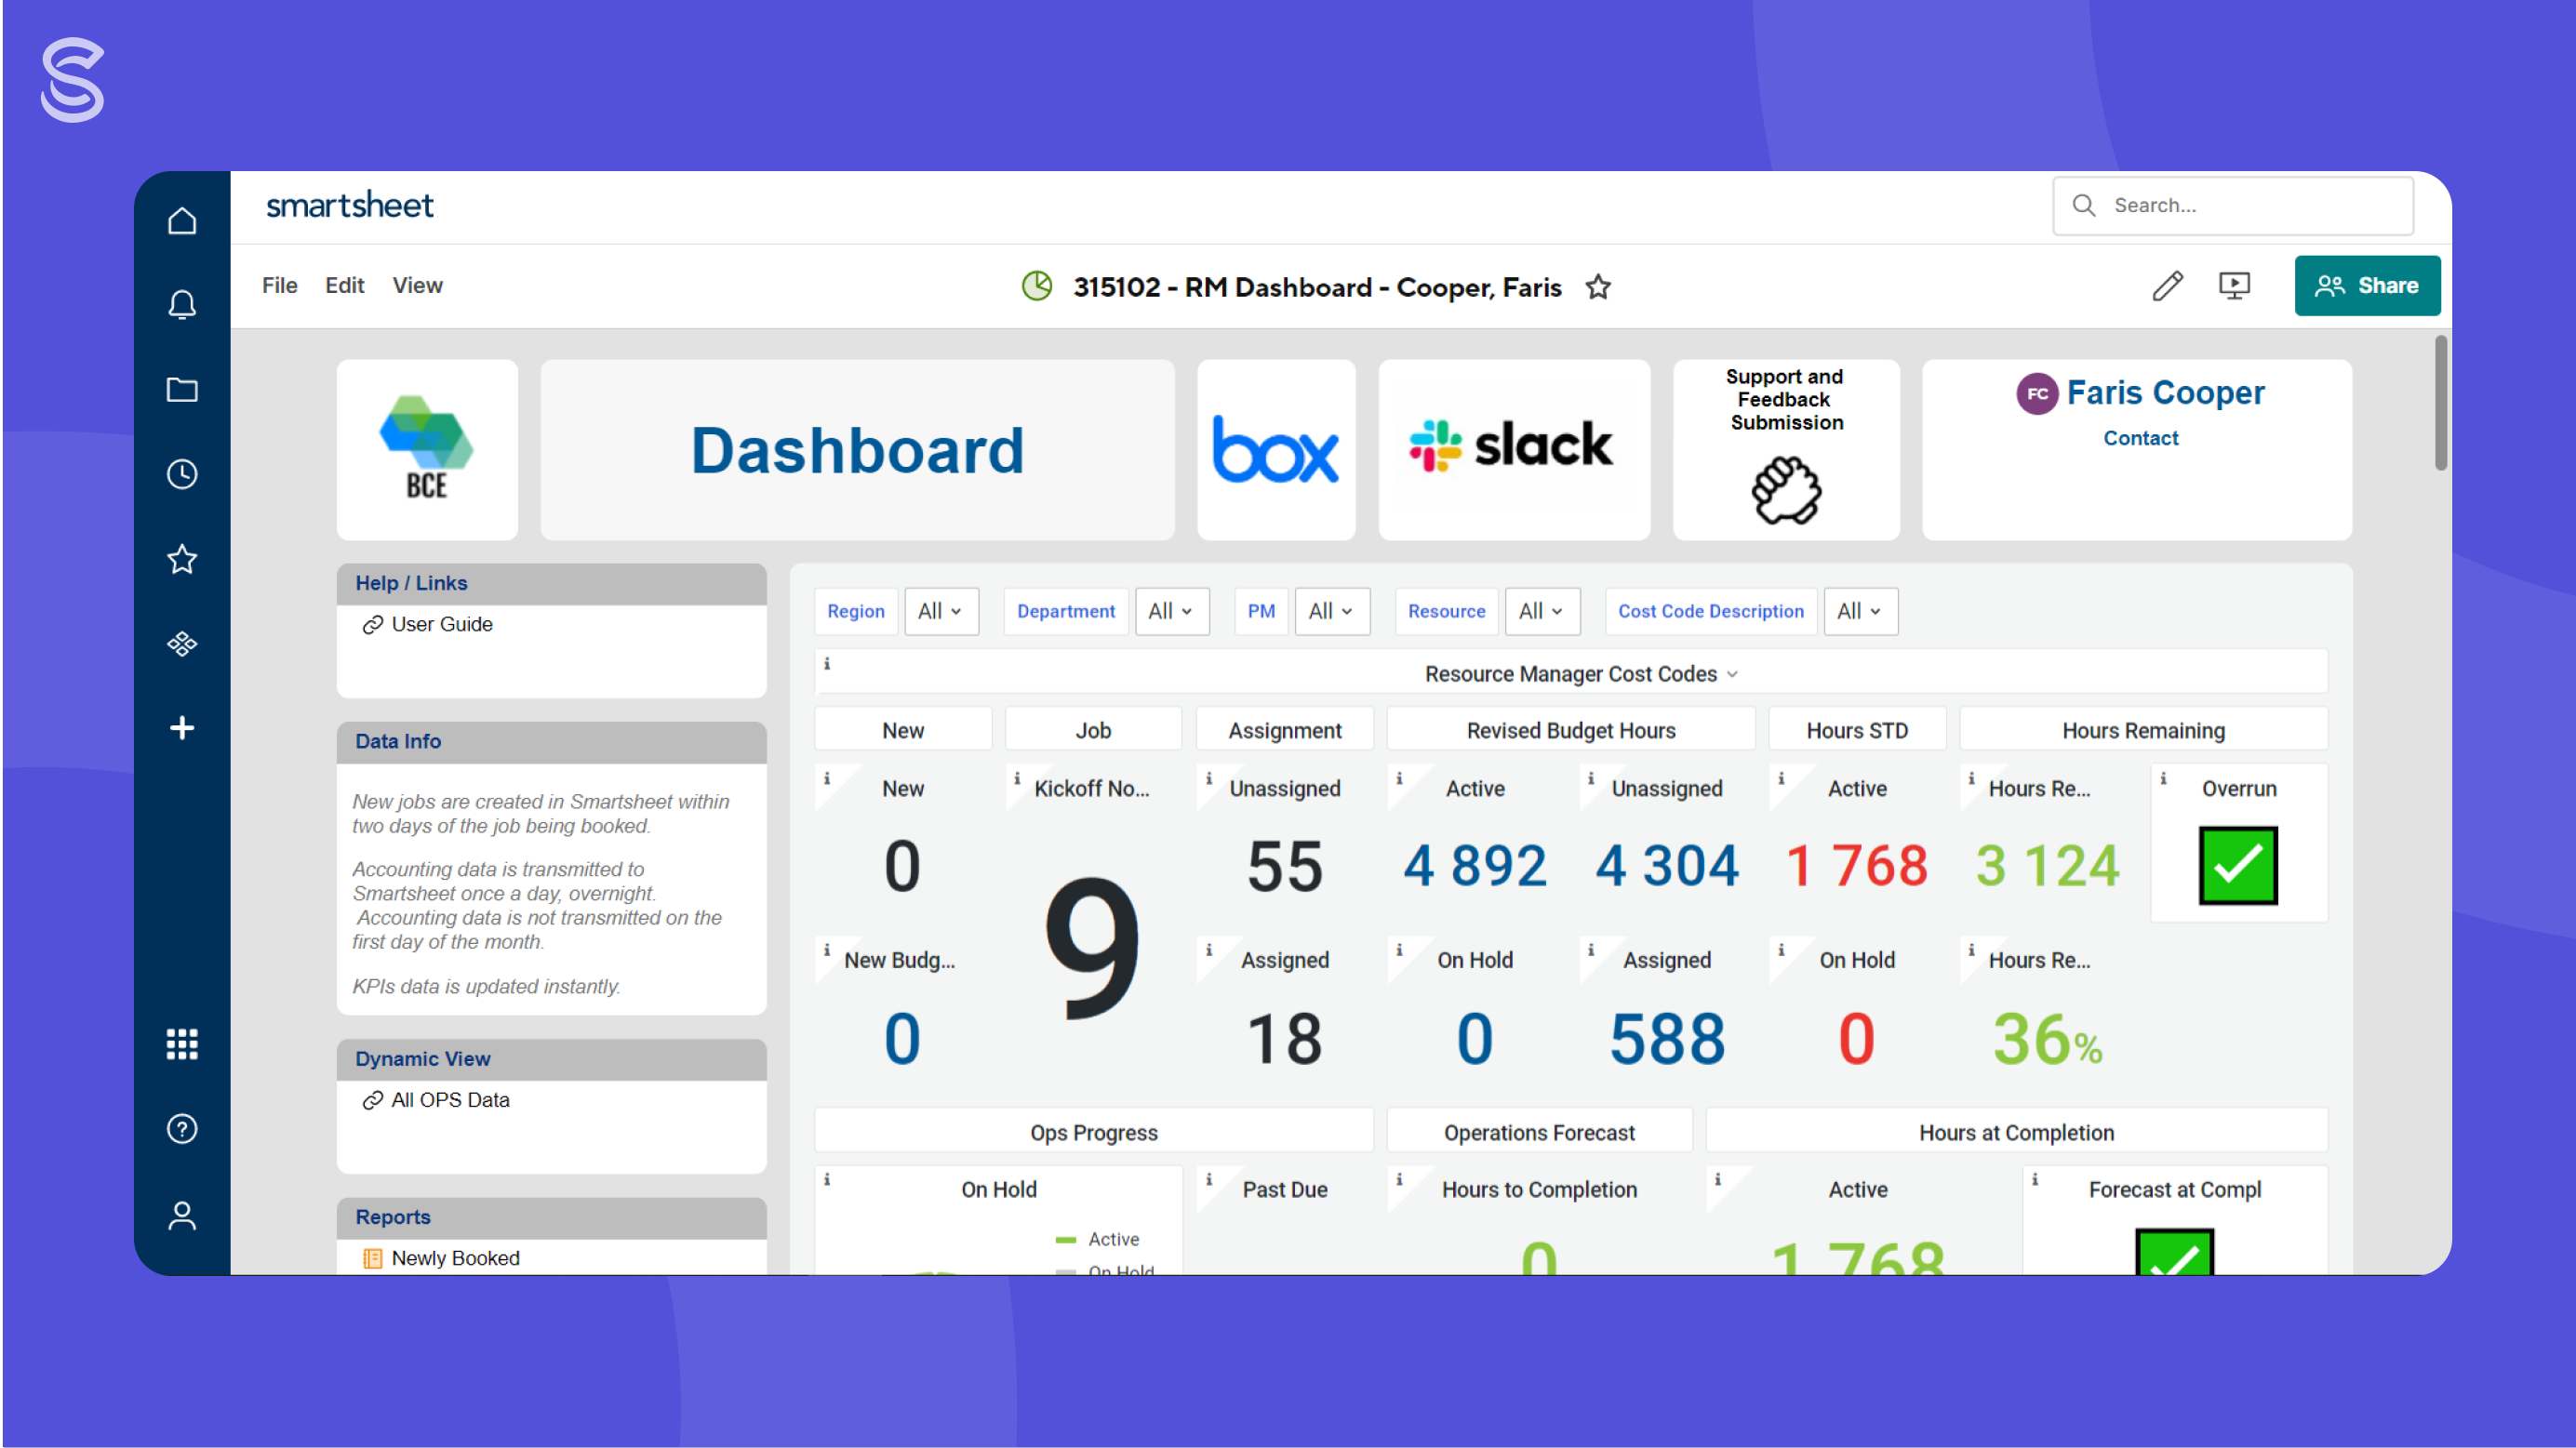
The same data can be visualized with various widgets depending on your needs and purposes.
The same data can be visualized with various widgets depending on your needs and purposes.
A rich set of tools and functions to manipulate, analyze, and transform data to drive meaningful visualizations and insights is available in Grafana.
Grafana's Bar Chart.png
How to get it:
Grafana Connector is free and open-source software. Detailed instruction on how to build a plugin from the source code and download the built plugin is available here (https://gitlab.com/cansolveit-public/smartsheet-backend-plugin-rust/-/blob/main/INSTALL.md).