How to Make a Timeline in Excel Using a Microsoft Template
To make a timeline using a Microsoft Excel template, search the existing templates and select the one you want to use. Next, fill in the template with your data and customize the fonts and colors to achieve the look you want.
Choose an Excel Timeline Template
Microsoft offers a few timeline templates in Excel designed to give you a broad overview of your project timeline. The Excel timelines aren’t tied to Gantt chart data, so you’ll manually input your own data in the pre-defined template fields. These aren’t set in stone; you can change names and add fields as needed.
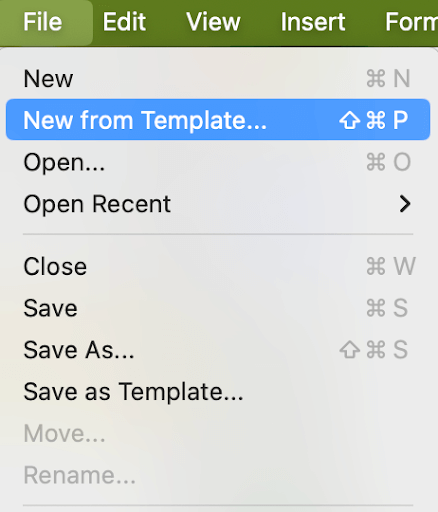
- To find an Excel timeline template from Microsoft, open Microsoft Excel. In the menu bar, select File and then New from Template…
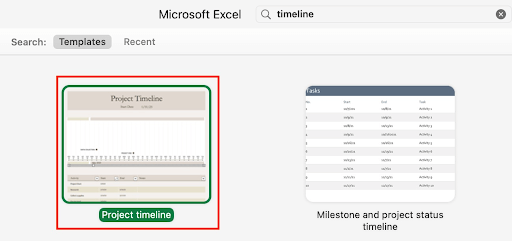
- Type timeline in the search box, and double-click on your preferred template to open the spreadsheet. Note: The template used here is called Project timeline and can be found with the latest version of Excel on MacOS Sonoma.
Add Your Information to the Timeline in Excel
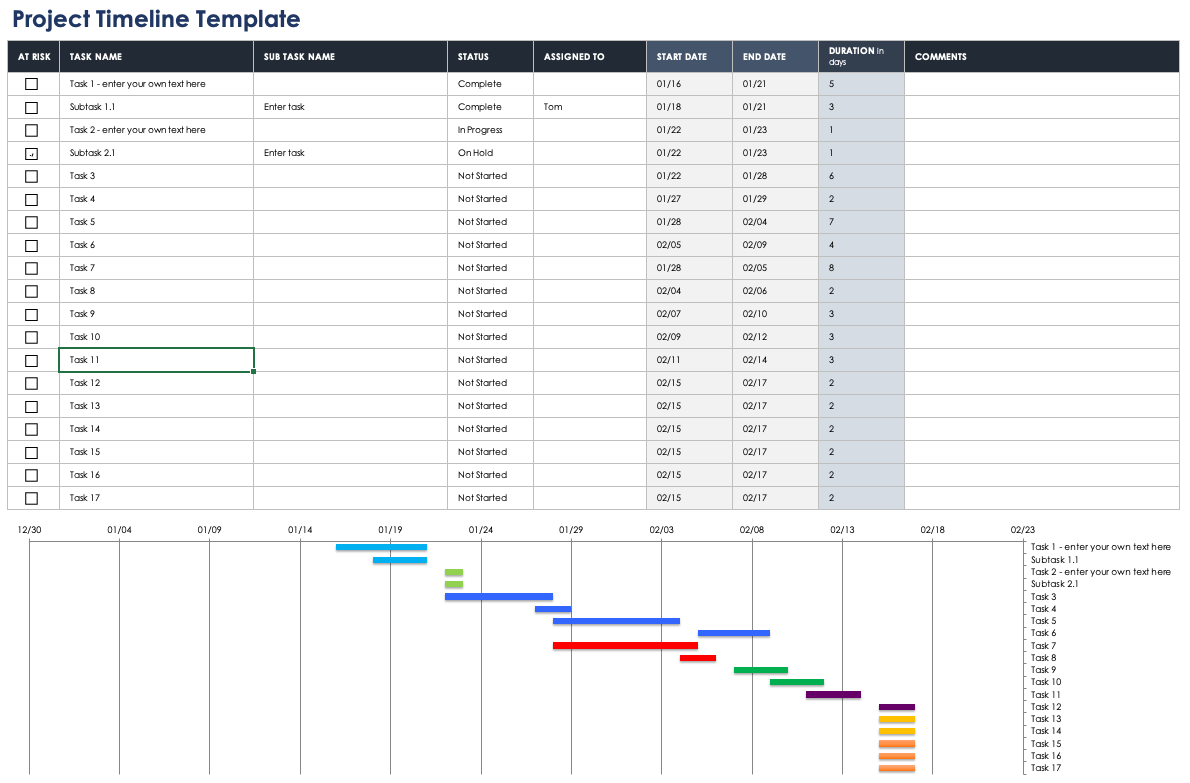
When the template opens, you will see a preformatted Excel spreadsheet with information already filled out in the fields. This content is a placeholder.
At the top of the template is a timeline. Scroll down to see the chart where you can add planning details and due dates.
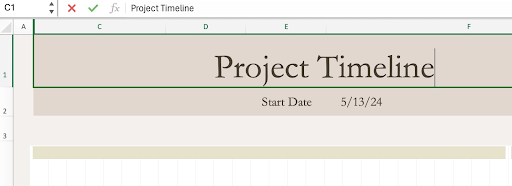
- Click the Project Timeline field (C1) at the top of the spreadsheet, and enter your project name.
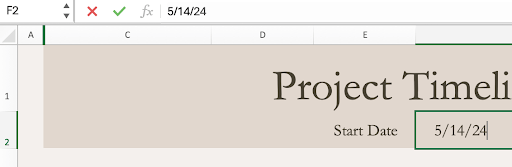
- Click the Start Date field (F2) below the timeline heading and enter your project start date. You’ll notice that the preformatted dates for the rest of the timeline changes once you update this field.
- Scroll down to the table. The template includes placeholder tasks in the Activity column, which can be customized to fit your project. Add your tasks to the Activity column by clicking on the fields with placeholder tasks and updating the text.
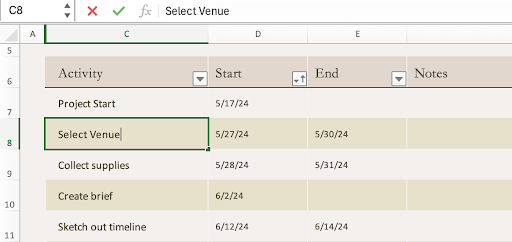
- Click the Tab key to navigate to the corresponding Start field, and type in the date of your first task. Click the Tab key again to enter a date in the End field. This should be the date that you expect to have completed the task.
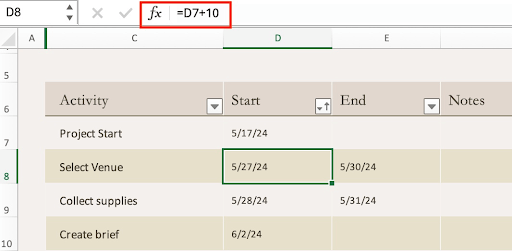
Note: The template includes formulas for all start and end dates, each based on the preceding task’s start date. You can delete the formulas and enter specific dates for each task, or you can customize the formulas to suit your schedule.
- Repeat steps 3 and 4 to fill in the remainder of the table.
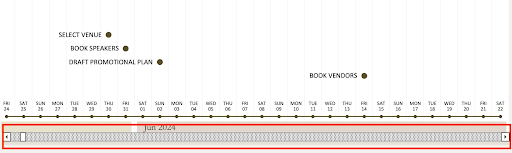
If the conference planning timeline extends past a month (it probably will), you can see more data on the timeline by clicking the arrows in the gray bar below the timeline. When you do this, you will scroll through the Excel timeline.
Customize the Excel Timeline
Once you have entered all the project milestones in the table, you can change the look of the timeline to make it more colorful.
Follow these steps to customize the look of your Excel timeline:
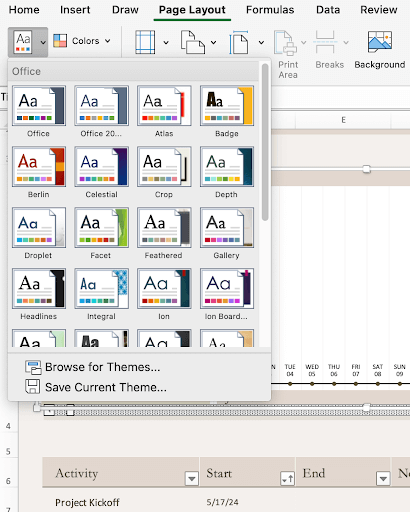
- To change the overall appearance of your template, click on the Page Layout tab and select Themes.
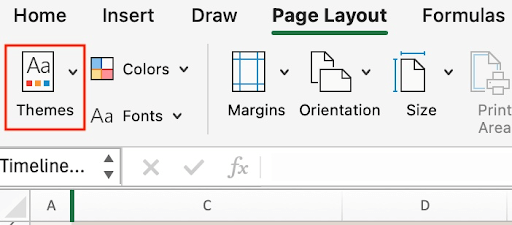
- Click on a theme to change the colors and fonts used in your timeline. You can also click on the Colors or Fonts menu to make changes to each element individually.
Change the Color Palette of the Excel Timeline
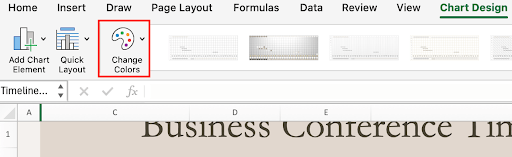
- Click on the timeline.
- Click on the Chart Design tab, and click the paint palette icon labeled Change Colors.
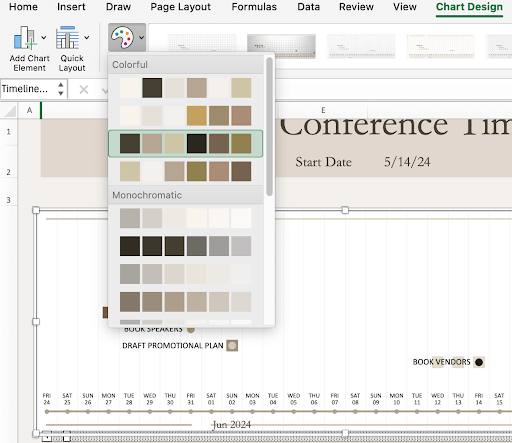
- The color options in this menu correspond with your chosen theme. If you see one you like, click it, and the timeline will be updated to reflect that style.
This timeline template only displays the most basic information. It’s great to share with stakeholders and executives to give them a high-level view of tasks required in your project. However, it doesn’t include elements such as a budget, nor does it display tasks that are being completed on time or who is responsible for each task.
If you want to create a more detailed project planning timeline, you might prefer a Gantt chart. Learn more in this guide to creating a Gantt chart in Excel.
How to Make a Timeline in Excel Using a Template
Download the Timeline Template for Excel
The easiest way to make a timeline in Excel is to use a premade template. An Excel template is especially useful if you don't have a lot of experience making a project timeline. All you need to do is enter your project information and dates into a table, and the Excel timeline automatically reflects the changes.
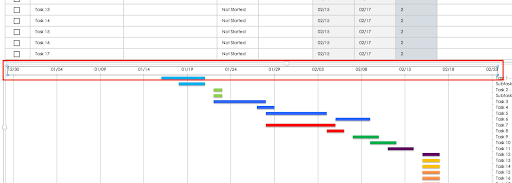
However, if you add your own dates to the table, the spacing in your timeline might be off. To fix this, simply use the following instructions:
- Click on a date at the top of your Gantt chart. A box should appear around all the dates.
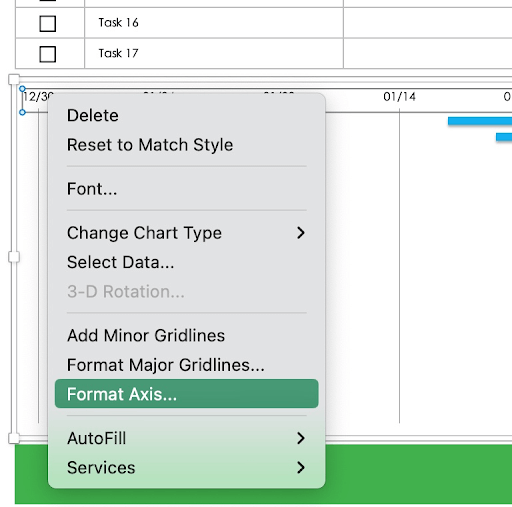
- Right-click and select Format Axis…
- In the pop-up window that appears on the right, select the Axis Options tab and navigate to the first section labeled Bounds.
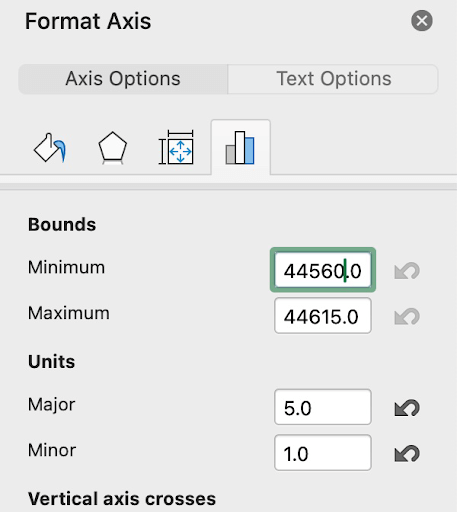
- Adjust the number in the box labeled Minimum. You will have to add numbers incrementally to the box to adjust the spacing and get it to look the way you would like.
How to Create a Timeline in Excel Using SmartArt
If all you need is a simple timeline graphic, you can use SmartArt in Excel to create one. The process of creating a timeline with SmartArt is quick and easy, but the timeline will be relatively basic. It’s best for providing a broad overview or tracking major milestones, rather than detailed or dynamic project planning.
- In the Insert tab of your spreadsheet, click the SmartArt icon: a green chevron with a text box illustration.
- Click Process to find timeline graphics and other process illustrations.
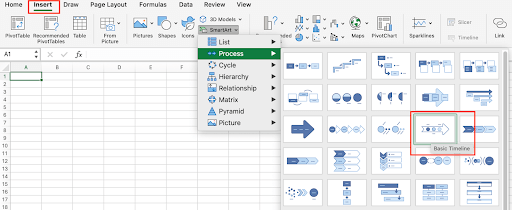
- Click the graphic of a basic timeline to insert it into your spreadsheet.
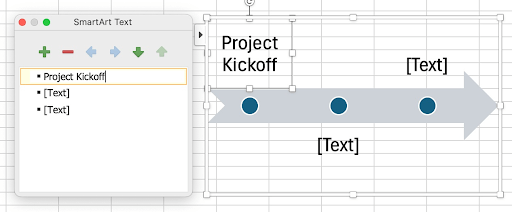
- A SmartArt text box will appear alongside the timeline graphic. Replace [Text] with your events or tasks.
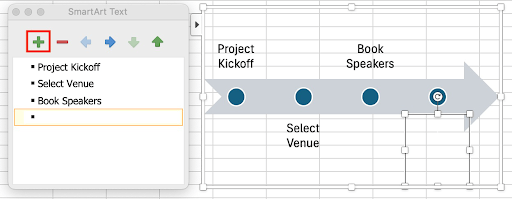
- Click the plus icon to add more markers in your timeline. You can also delete events with the minus icon or use the arrows to change the order of your events.
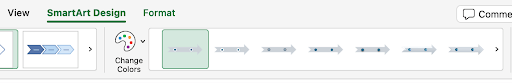
- To customize your timeline graphic, click the SmartArt Design tab. You can change the color palette or style of the timeline.
How to Create a Timeline in Excel Using a PivotTable
PivotTables in Excel are versatile tools for summarizing, analyzing, and presenting data. A timeline in a PivotTable is not a Gantt-style visualization of your data, but rather a dynamic tool for filtering data by time periods — such as months, quarters, and years — without altering that dataset.
To create a timeline using a PivotTable, follow these steps:
- Enter your data into an Excel sheet. If you would like example data to practice with, download this sample dataset, which captures sales transactions over a two-year period.
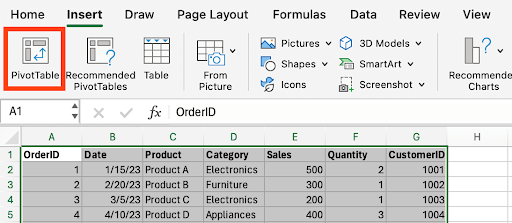
- Highlight the entire dataset, including the headers, and click the Insert tab.
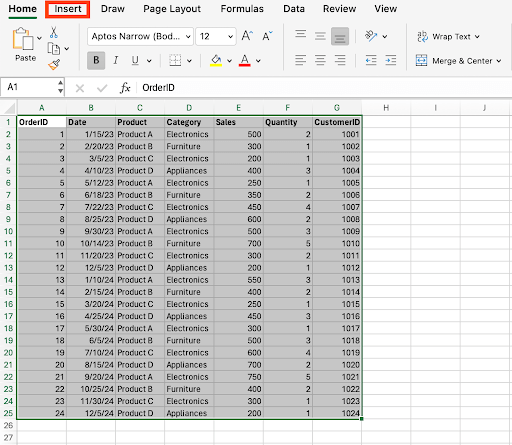
- In the Insert tab, click the PivotTable icon.
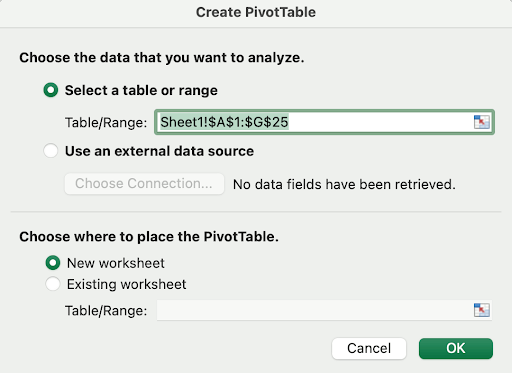
- A Create PivotTable pop-up window will appear. Confirm your PivotTable is drawing from the correct range and whether you want the PivotTable to appear in the existing worksheet or a new one. This example will show the PivotTable in a new worksheet. Click OK.
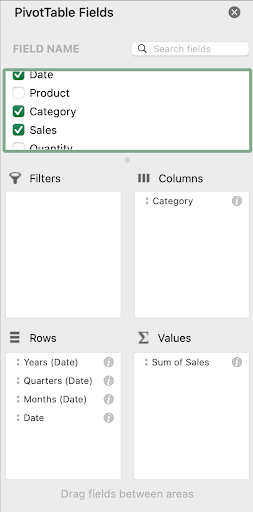
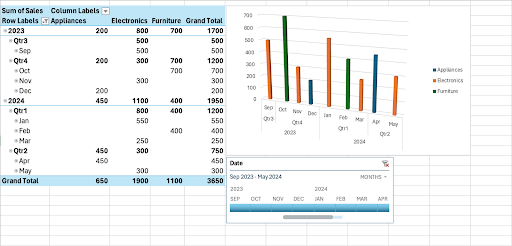
- Configure your table in the PivotTable Fields pane by dragging and dropping your table headers into the appropriate boxes. Drag Date into the Rows box and Sales into Values. You can also drag Category or Product into the Columns box to break down your data further.Your PivotTable will automatically populate in the sheet.
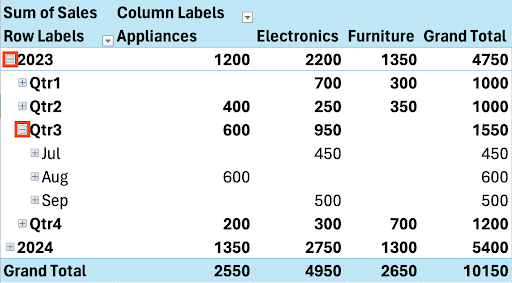
- The PivotTable will break down data by year. Click on the small plus (+) sign next to a row label to expand that item. For example, you can expand the year 2023 to show individual months or quarters.
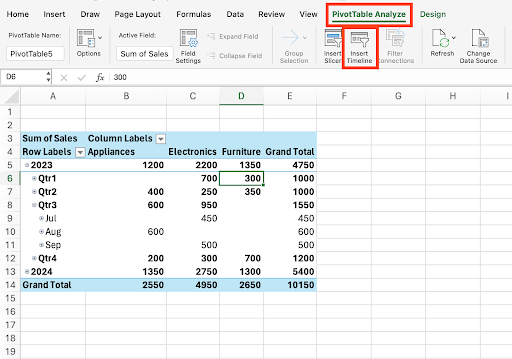
- Click the PivotTable Analyze tab, and click Insert Timeline.
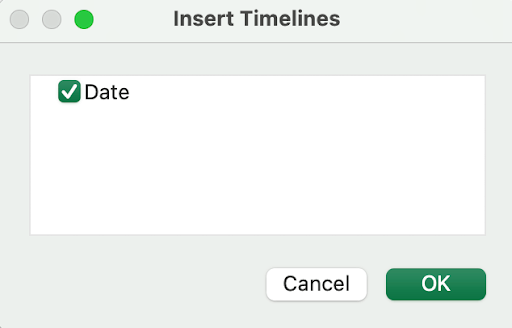
- In the Insert Timelines dialog box, check the box for Date and click OK. A timeline will appear in your worksheet.
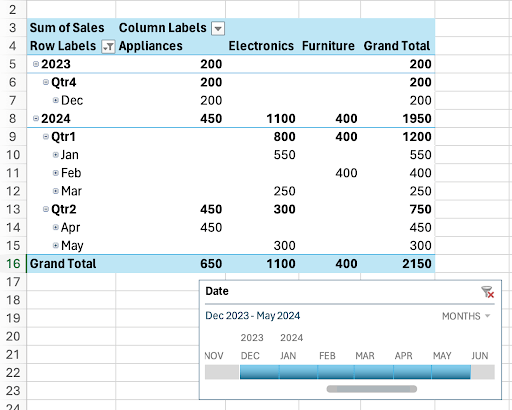
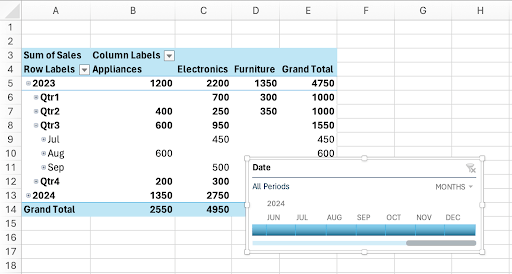
- Drag the handles in the timeline to adjust the time period. The PivotTable will update to reflect your filters.
- If you want another visual representation of your data, you can also create a PivotChart. Click any cell within the PivotTable and go to the Insert tab on the ribbon. Then, click PivotChart.
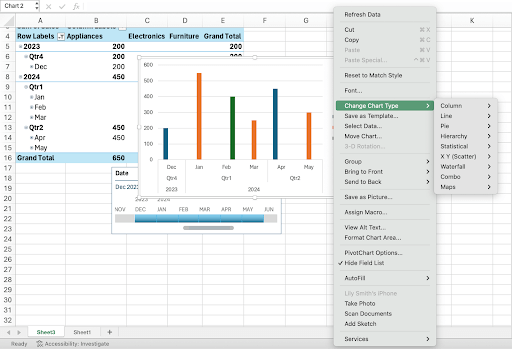
- The PivotChart will automatically populate as a bar chart in the sheet. To change the chart type, right-click your PivotChart, hover over Change Chart Type, and select from the options. A bar chart works well with this example dataset.
- Once you’ve selected your preferred chart type, click and drag the chart to position it in your sheet. Adjust the timeline to see the chart update based on the selected time period.
- Finally, continue to adjust the timeline to explore different periods and analyze sales trends. You can also filter by categories or products to view more granular data.
How to Create a Timeline in Smartsheet
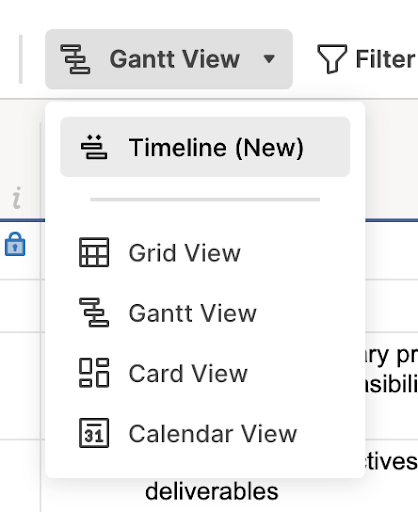
The Timeline feature in Smartsheet is a new view that you can access the same way you would select Gantt, Board, Calendar, or Grid views. You can access Timeline in any sheet that has one or more date columns.
Follow these steps to create and use a timeline in Smartsheet:
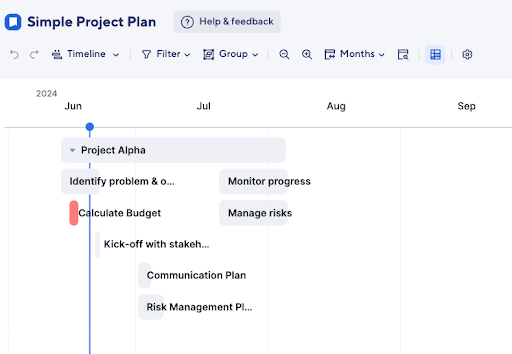
- Open an existing sheet with at least one date column in Smartsheet. In this example, we are working in a simple project plan template to show you how to customize features. Switch views and select Timeline. The screen will change from Grid View to Timeline View.
- The time span appears horizontally across the top.
You can group tasks to get a better view of how work is progressing. Click Group from the top navigation bar, and choose Assigned To in the drop-down menu for First by and Status in the drop-down menu for Then By.
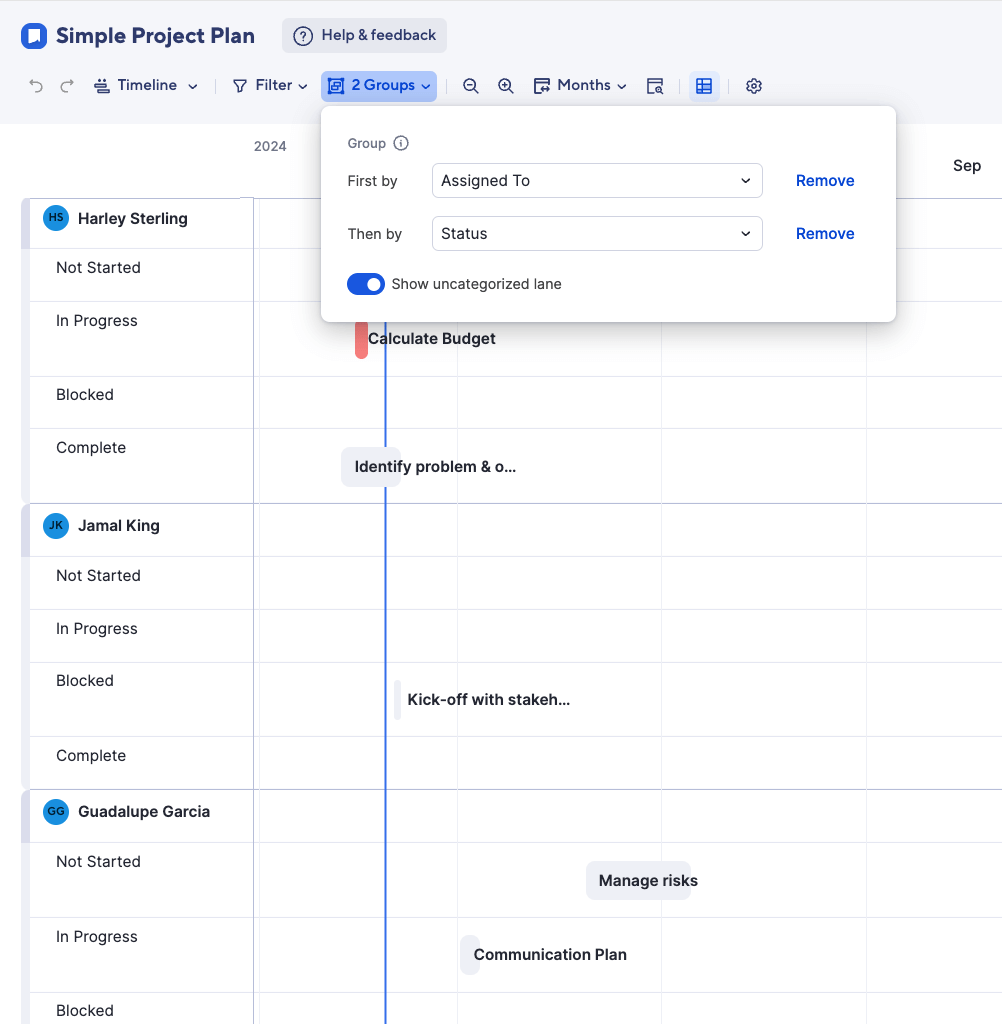
Note: You don’t need to select a filter for Then By. You can group by only one filter.
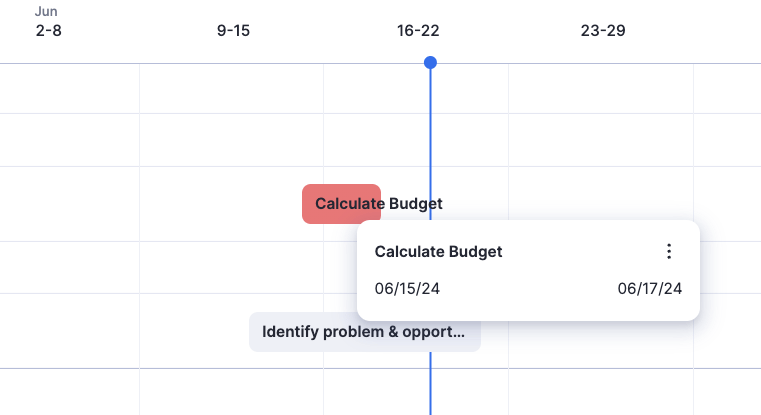
- On the timeline, Calculate Budget appears in red because this task is past due. Hover your mouse over the red bar to see more details about the task.
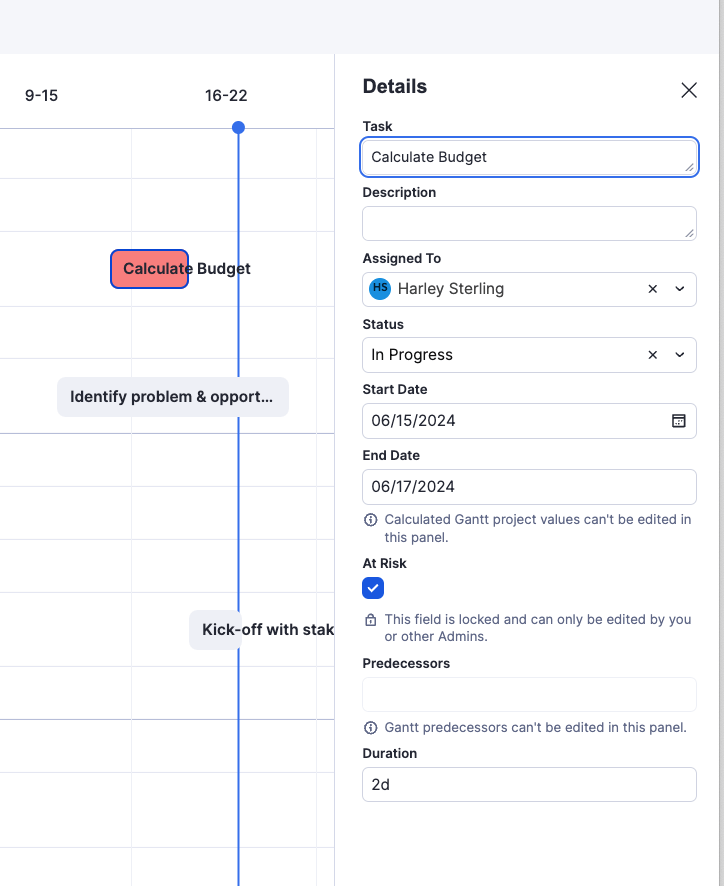
- You can edit the details for a task in Timeline View. Hover your mouse over a task, right-click, and click Edit details. A Details view appears on the right side. Click in any field and make changes. The changes are saved to the timeline.
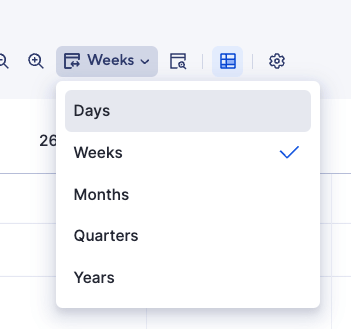
- Change the timescale for displaying tasks on the timeline by clicking the timescale icon in the top navigation bar and clicking Days, Weeks, Months, Quarters, or Years.
Make Better Decisions Faster with Timeline View in Smartsheet
Timeline view in Smartsheet empowers users to plan, visualize, and collaborate on date-based work in real-time, enabling you to effortlessly organize tasks, track progress, and communicate status.
In just a few clicks, launch your project’s timeline on any sheet to visualize your work, understand the details, and adjust information, making it easy to track project progress, detect blockers, and communicate statuses.
Discover how timeline view in Smartsheet can help your team visualize date-based work and achieve greater efficiency and transparency across projects.
Learn more about timeline view in Smartsheet.