What Are Project Management KPIs?
Project management KPIs are measurements that test the effectiveness of a project team’s methods. Project management executives use these metrics to gauge the performance of a company's current strategies and set the objectives of future strategies.
For more information, check out essential program management KPIs.
Project management that adapts to your needs
Work with flexibility and security—from small projects to large-scale processes and entire portfolios.
Smartsheet helps you break down projects into tasks, track progress, and manage resources, budgets, and workflows—all in one unified platform for seamless collaboration and delivery.
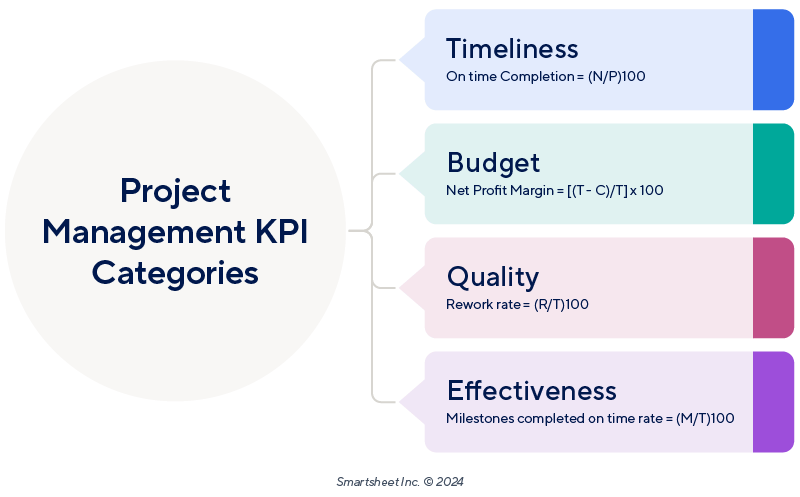
Categories of Project Management KPIs: Timeliness, Budget, Quality, Effectiveness
Project management KPIs fall into four main categories: maintaining a project’s timeliness, budget, high quality, and effectiveness. Below, you’ll find a detailed description of these categories.
Timeliness KPIs
Timeliness KPIs concern the time and steps a team requires to complete a project. Examples of timeliness KPIs include the percentage of on-time completion, the cycle time, and the overtime hours rate.
- Percentage of On-Time Completion: To calculate the percentage of on-time completion, divide the number of projects that the organization completed on time by the number of total projects, and multiply the result by 100. N equals the number of projects completed on time; P equals the number of total projects.
On-Time Completion = (N/P) x 100
- Cycle Time: This KPI measures the average amount of time it takes to complete a task. To calculate the cycle time, take the total amount of time it takes to complete all the tasks, and divide that figure by the total number of tasks. C equals the total amount of time it takes to complete all the tasks; T equals the total number of tasks.
Cycle Time = C/T
- Overtime Hours Rate: Calculating this KPI allows you to see if your processes are efficient or if there is a need to put more employees on a project. Take the total number of overtime hours that employees have worked, and divide that figure by the total number of hours that employees have worked. Then, multiply the result by 100. O equals the total number of overtime hours worked; T equals the total number of hours worked.
Overtime Hours Rate = (O/T) x 100
Budget KPIs
Budget KPIs track a team’s productivity and effectiveness regarding the use of the budget. Budget KPI examples include the net profit margin, gross burn rate, and budget variance.
- Net Profit Margin: This KPI shows the percentage of actual pure profit a company retains after subtracting its operating costs from its gross revenue. Determine the net profit by subtracting all the company costs from the total revenue. Then, divide that number by the total revenue and multiply by 100 for the percentage. C equals the company costs; T equals the total revenue.
Net Profit Margin = [(T - C)/T] x 100
- Gross Burn Rate: This KPI measures the speed at which you are burning money via expenses. Calculate this rate by dividing your total expenses for a specific period of time by the number of months in that period of time. E equals the total expenses for a specific period of time; M equals the number of months in that period of time.
Gross Burn Rate = E/M
- Budget Variance: This KPI shows how much your spending deviates from the organization’s budget allocation. Calculate the budget variance by subtracting the budgeted amount the company allocated to a project from the actual amount that you spent on the project. A equals the actual amount you spent on the project; B equals the amount that the company allocated to the project. If the resulting number is negative, that means you were under budget; if the resulting number is positive, then you were over budget.
Budget Variance = A - B
Quality KPIs
Quality KPIs assess the standard of a finished project and product. Examples of quality KPIs include the rework rate, scrap rate, and customer product return rate.
- Rework Rate: This number represents the percentage of work that a team has to redo in order to correct any problems. Calculate the rework rate by dividing the number of hours the team spent on reworks by the total number of hours the team worked. Then, multiply that figure by 100 to obtain the percentage. R equals the number of hours the team spent on reworks; T equals the total number of hours the team worked.
Rework Rate = (R/T) x 100
Scrap Rate: This KPI represents the percentage of a project’s/company’s materials that end up as scrap. Having this measurement is crucial to determining the quantity of materials you need to order for the future. Calculate the scrap rate by dividing the number of scrapped materials by the total number of materials and then multiplying the result by 100. S equals the number of scrapped materials; P equals the total number of materials.
Scrap Rate = (S/P) x 100
- Customer Product Return Rate: Calculate the customer product return rate to see if returns are eating up your sales. Divide the cost of the returns by the total sales number, and multiply the result by 100. R equals the cost of the returns; S equals the total sales number.
Customer Product Return Rate = (R/S) x 100

Timothy Jerome is a PMP, MBA, professor, research lecturer, advisor, and trainer in project management and business sciences. He says that when you’re balancing timeliness and quality KPIs, “You have to give equal and simultaneous consideration to both urgency and quality — and you can't rush quality. You're always balancing the concern about meeting your deadline with the concern about doing the work correctly.”
Effectiveness KPIs
Effectiveness KPIs determine whether a project produced the result that the team set out to achieve. Examples of effectiveness KPIs include the milestones completed on time rate, the customer acquisition cost, and earned value,
- Milestones Completed on Time Rate: Determine the milestones completed on time rate by dividing the number of milestones completed by the total number of milestones in a project. Then, multiply the result by 100. M equals the number of milestones completed; T equals the total number of milestones in the project.
Milestones Completed on Time Rate = (M/T) x 100
- Customer Acquisition Cost: The customer acquisition cost helps determine if your projects and marketing are effective. To calculate this KPI, divide the total cost of sales and marketing expenses by the number of customers acquired. C equals the total cost of sales and marketing expenses; N equals the number of customers acquired.
Customer Acquisition Cost = C/N
- Earned Value: Earned value allows the project manager to determine the cost of a project at any point during the project. To calculate this KPI, take the percentage of work completed, and multiply it by the total budget. P equals the percentage of work completed; B equals the total budget.
Earned Value = P x B
Project Manager KPI Cheat Sheet
Download the Project Management KPI Cheat Sheet for Adobe PDF
Use this project management KPI cheat sheet when you’re starting a project and looking for formulas to use when setting up your KPI categories and types.
Check out these free project success templates and checklists for more easily downloadable project planning aids.
Types of Project Management KPIs
Within the categories of project management KPIs, different types of KPIs help measure the success of your KPI categories.
Learn about project monitoring and fine-tune your use of KPI types.

To determine the best types of KPIs for your project, Matthew Wagner, a Senior PMO and Technical Consultant at Global PMO Partners, says that the type of KPIs you choose depends on the type of project you are taking on: “There are so many different types of projects. Quite often, a company doesn’t know what it wants to track. In such a case, we use PMI (Project Management Institute) best practices. Best practices for KPIs are associated with the triple constraints, scope, schedule, and budget, which are suited to a more traditional project.”
Read about the triple constraint triangle theory to learn more about its role in project management.
When determining which KPIs to use for a project, you must remember that “each project has its unique fingerprint,” says Timothy Jerome. “You want your KPIs to be meaningful and to address not just functionality but also value.” Jerome emphasizes how critical the earned value KPI is to project management. Earned value “gives project managers key visibility into the relationship between progress and the budget.”
Examples of PM KPIs by Type
Understanding different types of project management KPIs is vital to project managers. Below, you’ll find a discussion of such codification, including helpful examples and formulas. Types of PM KPIs include process KPIs, input KPIs, output KPIs, leading KPIs, lagging KPIs, qualitative KPIs, and quantitative KPIs.
Process KPIs measure process efficiency. Input KPIs concern the resources and monitoring you require at the outset of a project, while output KPIs track the outcomes of a project. Leading KPIs track the numbers of various nodes before a project, and lagging KPIs track past performance metrics.
Qualitative KPIs look at the non-numerical experience of a service, product, or work process, while quantitative KPIs look at numerical data to track progress toward business goals.
Process KPIs
Process KPIs measure the effectiveness of the processes you undertake to complete a project. Example process KPIs include the average time per task, number of complaints, and first-time right task rate.
- Average Time per Task: The average time per task measures the efficiency of a task by calculating the average time it takes to complete each discrete task within a larger project. This KPI helps project managers identify how to optimize a project’s workflow. To calculate the average time per task, take the total amount of time, and divide it by the number of tasks. T equals the total amount of time; N equals the number of tasks.
Average Time per Task = T/N
- Complaint Rate: By tracking the number of complaints, you can identify the steps in a process where issues are occurring and fix those problems. Calculate the complaint rate by taking the number of complaint emails and dividing it by the total number of emails received. Then, multiply the result by 100. N equals the number of complaint emails; T equals the total number of emails received.
Complaint Rate = (N/T) x 100
- First-Time Right Task Rate: The first-time right task rate evaluates whether a process’s reworks are cost and time efficient. To calculate this KPI, take the number of tasks completed correctly on the first try, and divide it by the total number of tasks. Then, multiply the result by 100. F equals the number of tasks completed correctly on the first try; N equals the total number of tasks.
First-Time Right Task Rate = (F/N) x 100
Input KPIs
Input KPIs are the amount of resources you need to invest in a project in order to finish the project and achieve the desired result. Example input KPIs include the number of hours worked, cost of staff training, and percentage of budget spent.
- Cost of Labor Hours Compared to the Overall Budget: Measuring the cost of labor on a project helps you determine the percentage of your budget you’re allocating to labor hours. To calculate the cost of labor hours compared to the overall budget, take the cost of labor hours, divide it by the total budget dollar amount, and then multiply the result by 100. C equals the cost of labor hours; T equals the total budget.
Cost of Labor Hours Compared to the Overall Budget = (C/T) x 100
Cost of Staff Training Compared to the Overall Budget: Measuring the cost of staff training can help you determine whether your staff’s level of expertise is causing inefficiencies. To calculate the cost of staff training compared to the overall budget, take the cost of staff training, divide it by the total budget dollar amount, and then multiply the result by 100. S equals the cost of staff training; T equals the total budget.
Cost of Staff Training Compared to the Overall Budget = (S/T) x 100
- Percentage of Budget Spent: Tracking this KPI allows you to determine your budget for future projects. To calculate the percentage of budget spent, divide the amount of the budget spent on your last project by the total starting budget allocation for the project, and then multiply the result by 100. B equals the amount of the budget spent; T equals the total starting budget allocation.
Percentage of Budget Spent = (B/T) x 100
Output KPIs
Output KPIs measure quantifiable results from a project or product, indicating the success or failure of your project processes. Output KPI examples include new customers that resulted from a project, new revenue earned from a project, and new social media followers gained after a project.
- New Customers That Resulted from a Project: Tracking the number of new customers after a project helps you determine if the project drew in new business and awareness. To calculate the number of new customers post-project, subtract the number of customers you had before the launch of a project from the number of customers you have after the project. S equals the starting number of customers before the launch of a project; N equals the number of customers you have after the launch of the project.
New Customers = N - S
- New Revenue Earned from a Project: This KPI is a particularly direct measurement of the success of a project. To determine new revenue earned from a project, subtract the revenue that exists before the project from the total revenue that the project generates. A equals the total revenue that the project generates; S equals the revenue that exists before the project.
New Revenue Earned from a Project = A - S
- New Social Media Followers Gained After a Project: Knowing the number of social media followers that you gain from a project helps you determine if you are expanding brand awareness. To find out the number of new followers you’ve gained after a project, subtract the number of followers you had on a social media platform before the launch of the project from the number of followers you have after the project. S equals the number of followers before the launch of a project; N equals the number of followers after the launch of the project.
New Social Media Followers Gained After a Project = N - S
Leading KPIs
Leading KPIs allow you to set projections before a project to determine whether you achieved the desired outcomes after you launch the project. Some leading KPI examples include organic website traffic, the conversion rate of leads that become sales, and the cost to deliver a good or service.
- Organic Website Traffic: This KPI is a useful indicator of whether a project will be successful. To calculate an increase or decrease in organic website traffic, subtract the number of organic website clicks before a project from the number of organic website clicks after the project. A equals the number of organic website clicks after a project; B equals the number of organic website clicks before the project.
Organic Website Traffic = A - B
- Conversion Rate of Leads That Become Sales: To calculate this KPI, take the number of leads that become sales, and divide it by the total number of leads. Then, multiply the result by 100. L equals the number of leads that become sales; T equals the total number of leads.
Conversion Rate of Leads That Become Sales = (L/T) x 100
- Cost to Deliver a Good or Service: Calculate this KPI by dividing the amount of money it took to create a product, including labor and capital, by the number of goods. M equals the amount of money it took to create a product, including labor and capital; N equals the number of goods.
Cost to Deliver a Good or Service = M/N
Lagging KPIs
Lagging KPIs measure a project’s past performance or an organization’s past actions. Lagging KPI examples include the sales revenue, renewal rate, and customer churn rate.
- Sales Revenue: Looking at last quarter’s sales revenue helps you determine your current business capacity, so you can set new goals to grow and change business practices. Use this KPI to make decisions about future projects.
- Renewal Rate: This KPI measures the number of customers who are renewing a company’s services, software, or contract. To calculate the renewal rate, take the number of customers that have renewed at the end of the renewal period, and divide that by the total number of customers at the end of the renewal period. Then, multiply the result by 100. R equals the number of customers that have renewed at the end of the renewal period; T equals the total number of customers at the end of the renewal period.
Renewal Rate = (R/T) x 100
- Customer Churn Rate: This KPI tracks the number of customers who have not renewed a company’s services or have stopped doing business with the company for whatever reason. Determine the customer churn rate by dividing the number of customers who have discontinued a company’s service during a set time period by the total number of customers during that set time period. Then, multiply the result by 100. D equals the number of customers who have discontinued a company’s service; T equals the total number of customers.
Customer Churn Rate = (D/T) x 100
Qualitative KPIs
Qualitative KPIs encompass non-numerical performance metrics that concern a person’s subjective experience of a product, service, or process. Qualitative KPI examples include employee satisfaction surveys, brand perception, and ratings of customer satisfaction.
- Employee Satisfaction Surveys: These surveys document staff perceptions about the following: the efficiency of your company’s systems and processes, as well as the ability of your employees to perform their jobs, given the tools with which the organization has provided them. To track employee satisfaction, create a detailed survey that asks which processes are working well, which ones aren’t, and what the company can do to improve processes.
- Brand Perception: Monitoring brand perception helps a company tweak its product or service experience in order to gain more market share and brand awareness. Create a customer survey or set up a focus group to help you track brand perception.
- Ratings of Customer Satisfaction: By looking at customer satisfaction ratings, a company can assess whether it is creating a highly salable product or service, or whether there is a breakdown in the firm’s processes. To generate a qualitative KPI such as customer satisfaction, send out a survey that customers can fill out after the launch of a service, product, or process.
Quantitative KPIs
Quantitative KPIs are numerical-based data that indicate whether the processes that you’re implementing are allowing you to achieve your business goals. Quantitative KPI examples include schedule variance, billable utilization, and a cost performance index.
- Schedule Variance: This KPI measures the difference between the actual amount of project completion by a specific date and the planned amount of project completion by that date. Track schedule variance by subtracting the budgeted cost originally allocated for work up to that specific date from the actual cost of work performed up to that date. If the resulting number is positive, then you are ahead of schedule. If the resulting number is negative, then you are behind schedule. W equals the actual cost of work performed up to a specific date; B equals the budgeted cost originally allocated for work up to that date.
Schedule Variance = W - B
- Billable Utilization: Billable utilization tracks the efficiency of a project by comparing the time you spent working billable hours for a client with the total number of hours you worked. Calculate this KPI by dividing the total billable hours you worked for a client by the total number of hours you worked. Then, multiply the result by 100 to get a percentage. B equals the total billable hours you worked for a client; A equals the total number of hours you worked.
Billable Utilization = (B/A) x 100
- Cost Performance Index: This index helps you determine the profit of a project generated relative to its cost. You can determine the cost performance index by dividing the revenue a project generated by the total cost of the project. Then, multiply the result by 100. R equals the revenue a project generated; T equals the total cost of the project.
Cost Performance Index = (R/T) x 100
Project Management KPI Dashboard

Download the Project Management KPI Dashboard for Excel
Use this template to plan projected task completion on a visual timeline, track task status, and see what percentage of the total allocated budget you’ve spent so far.
Find more KPI dashboard templates and learn more about KPI dashboards.
Maximize the Efficiency & Success of Your Projects with Project Management KPI Examples by Category and Type from Smartsheet
From simple task management and project planning to complex resource and portfolio management, Smartsheet helps you improve collaboration and increase work velocity -- empowering you to get more done.
The Smartsheet platform makes it easy to plan, capture, manage, and report on work from anywhere, helping your team be more effective and get more done. Report on key metrics and get real-time visibility into work as it happens with roll-up reports, dashboards, and automated workflows built to keep your team connected and informed.
When teams have clarity into the work getting done, there’s no telling how much more they can accomplish in the same amount of time. Try Smartsheet for free, today.