Basic Value Stream Map Template
Download a Blank Basic Value Stream Map Template for
Excel
|
Microsoft Word
| Google Docs
Download a Sample Basic Value Stream Map Template for
Excel
|
Microsoft Word
| Google Docs
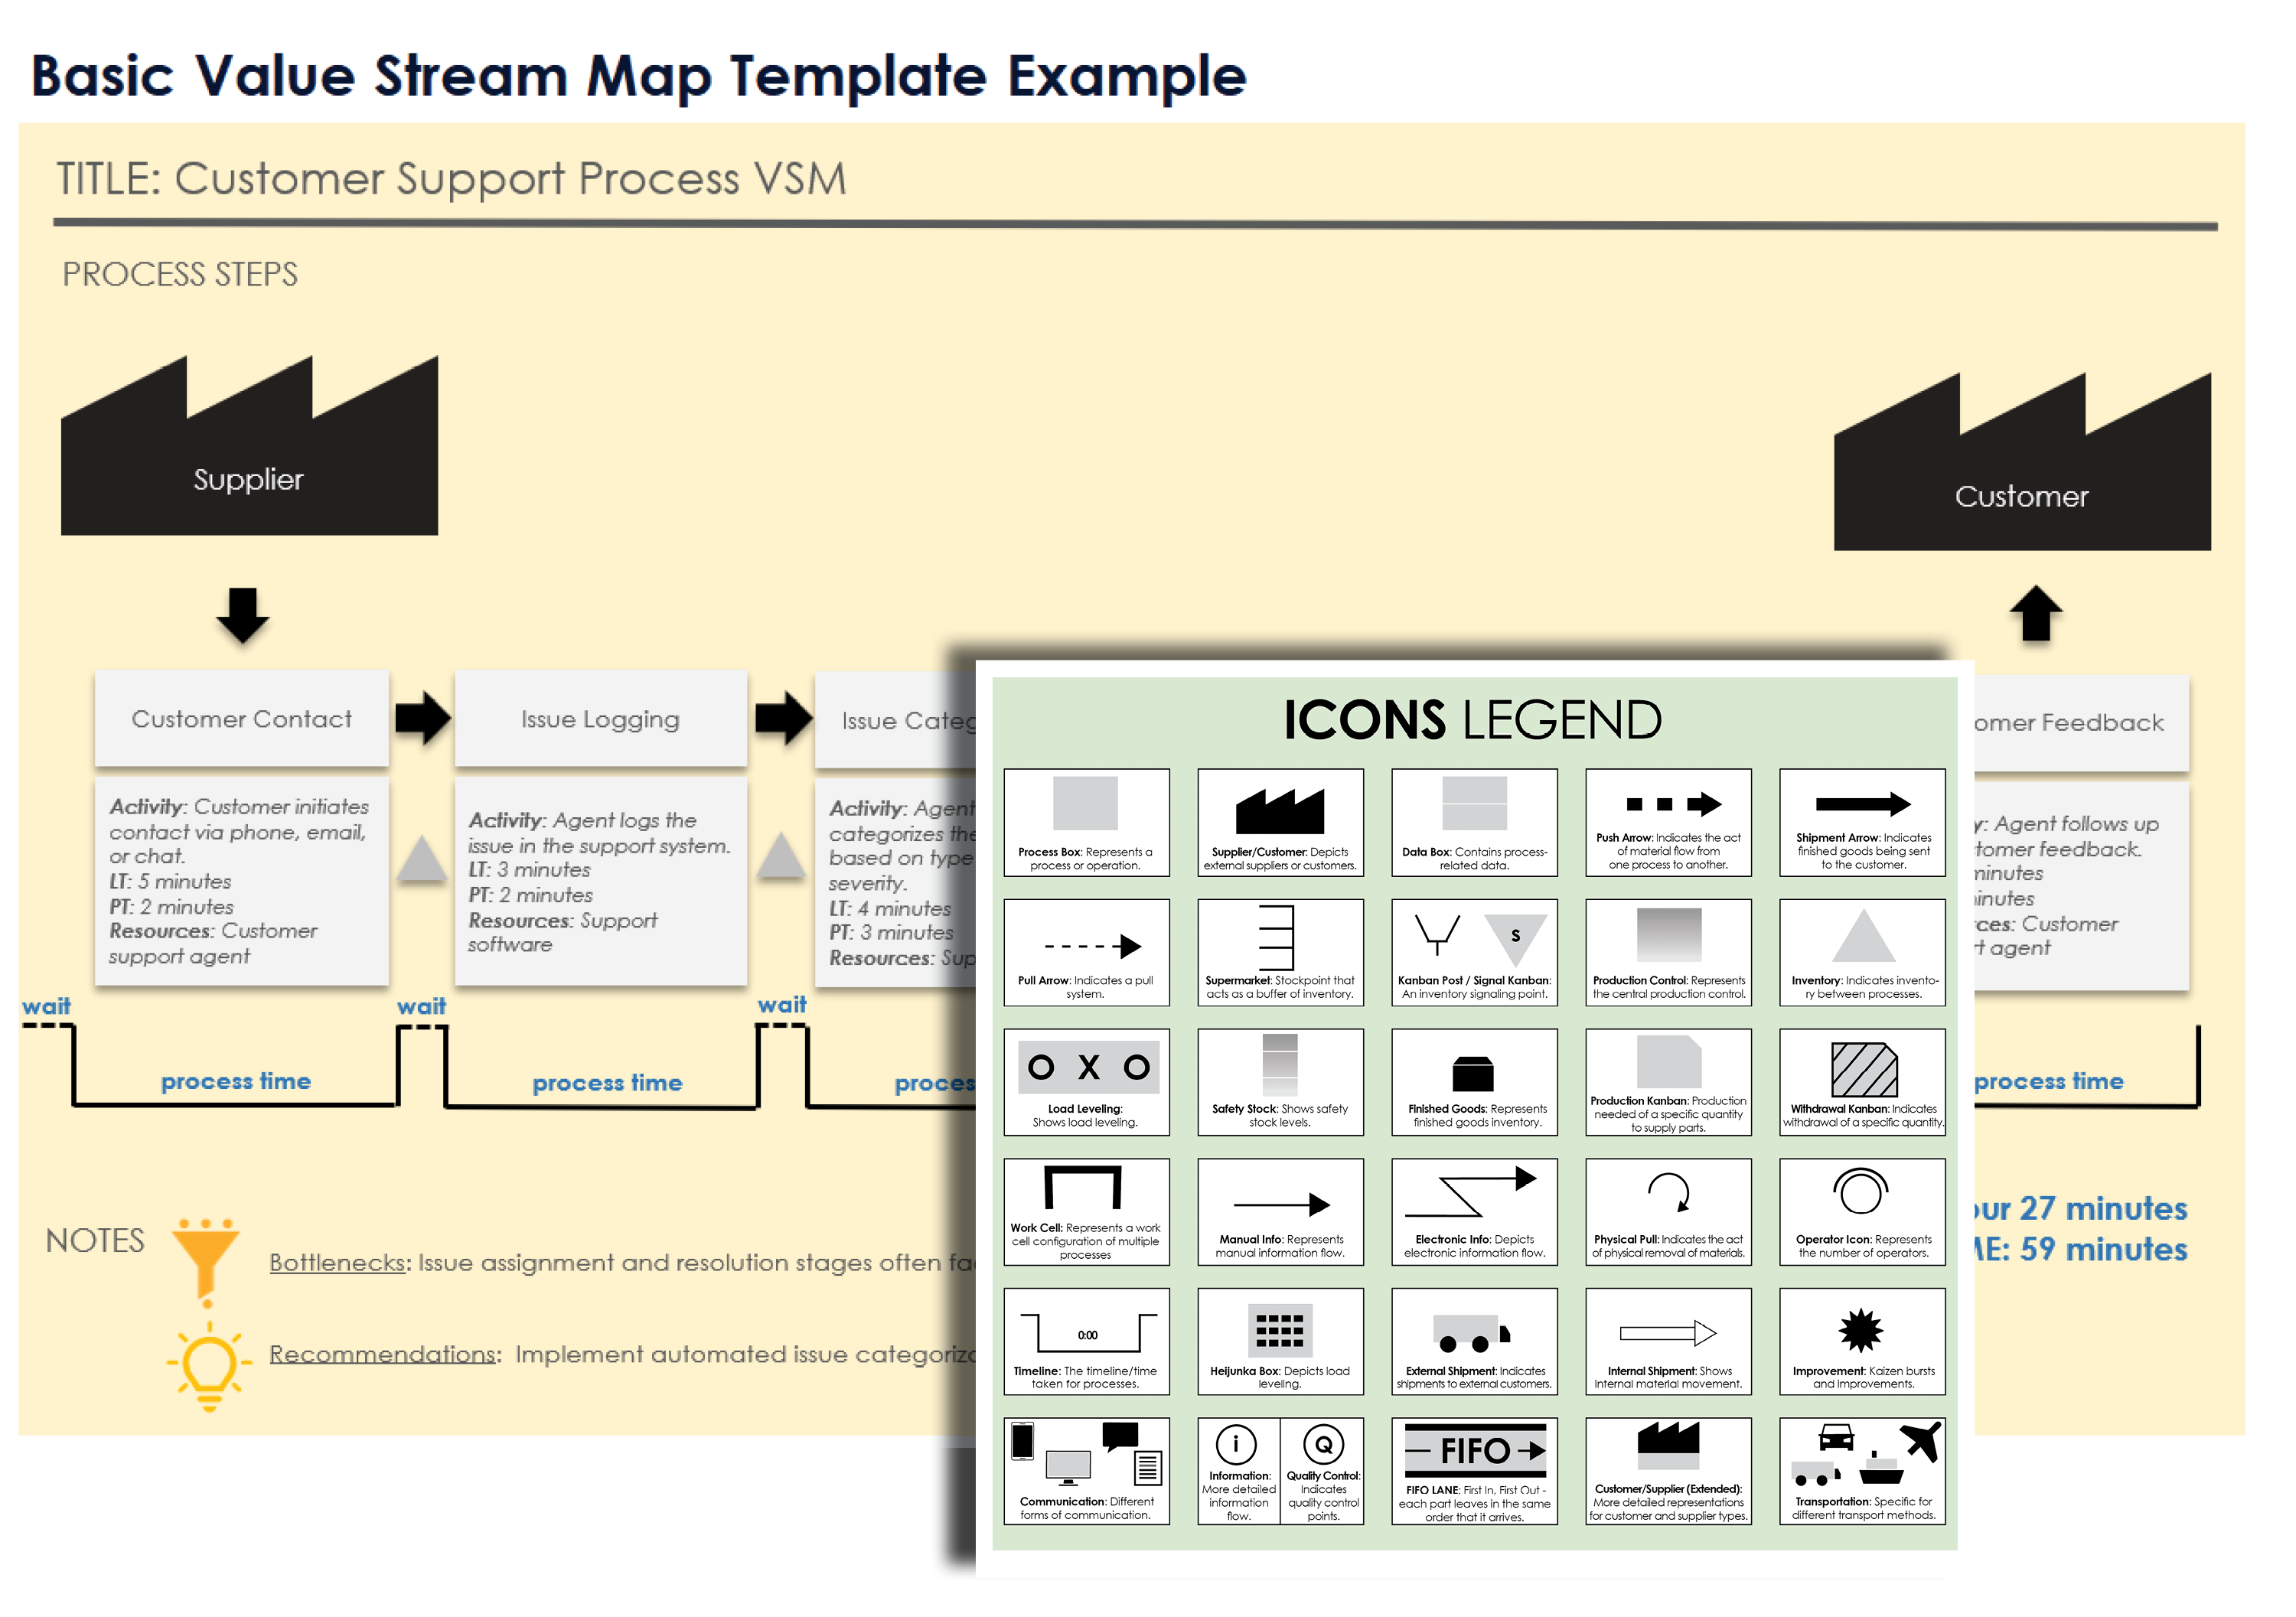
When to Use This Template: Use this basic value stream map template to visualize your process in sequence and analyze how materials and information move through your workflow. Download the version with sample copy for pointers on using a value stream map to identify inefficiencies.
Notable Template Features: This template features a clear layout that enables you to map each step of your process. It includes symbols for processes, inventory, and information flow, facilitating easy identification of bottlenecks and waste.
Enhance your value stream mapping efforts by exploring this article on everything you need to know about Lean manufacturing tools to streamline your production processes.
Basic Value Stream Map Slide Template
Download a Blank Basic Value Stream Map Slide Template for
PowerPoint
| Google Slides
Download a Sample Basic Value Stream Map Slide Template for
PowerPoint
| Google Slides
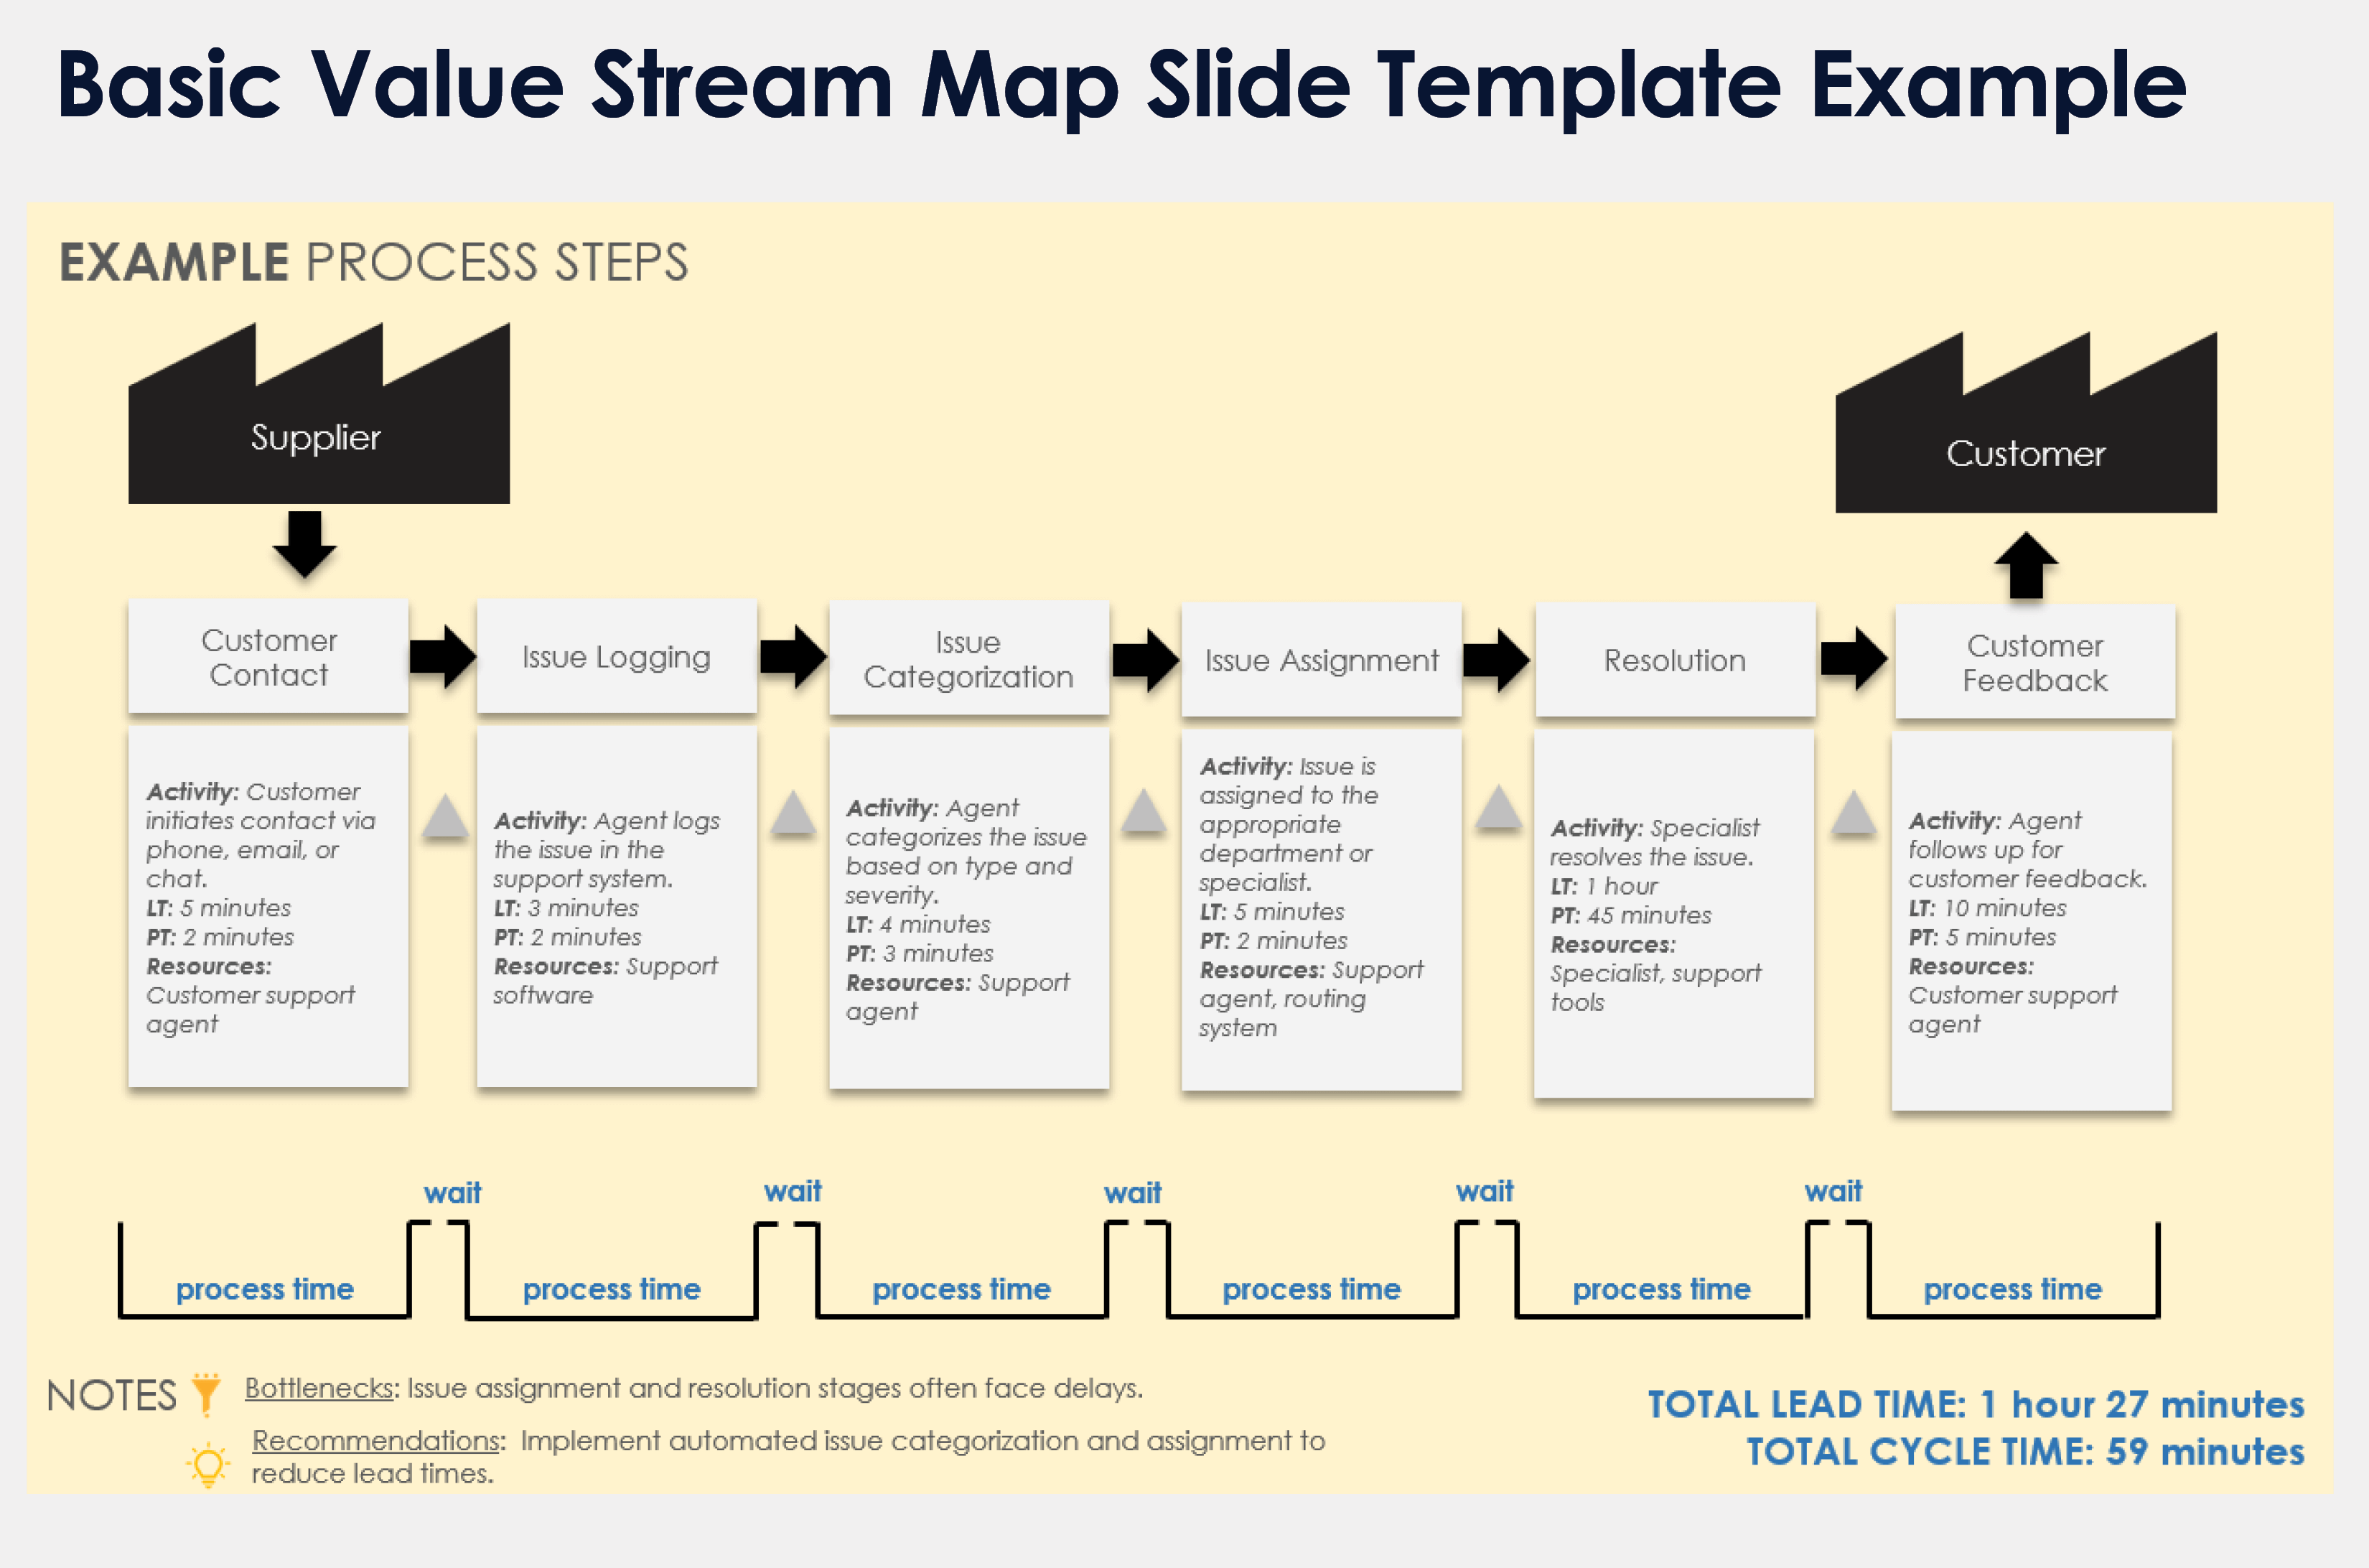
When to Use This Template: Use this basic value stream map slide template to present a clear visual of your process during meetings. Available with or without sample data, this template is ideal for conveying the flow of materials and information, as well as highlighting areas for improvement.
Notable Template Features: This template’s visually engaging slides incorporate straightforward symbols to delineate processes, inventory, and information flow. Its simple design makes it an essential tool for communicating potential bottlenecks to stakeholders and developing strategies to eliminate waste.
Value Stream Current State Map Template
Download a Blank Value Stream Current State Map Template for
Excel
|
Microsoft Word
|
PowerPoint
Download a Sample Value Stream Current State Map Template for
Excel
|
Microsoft Word
|
PowerPoint
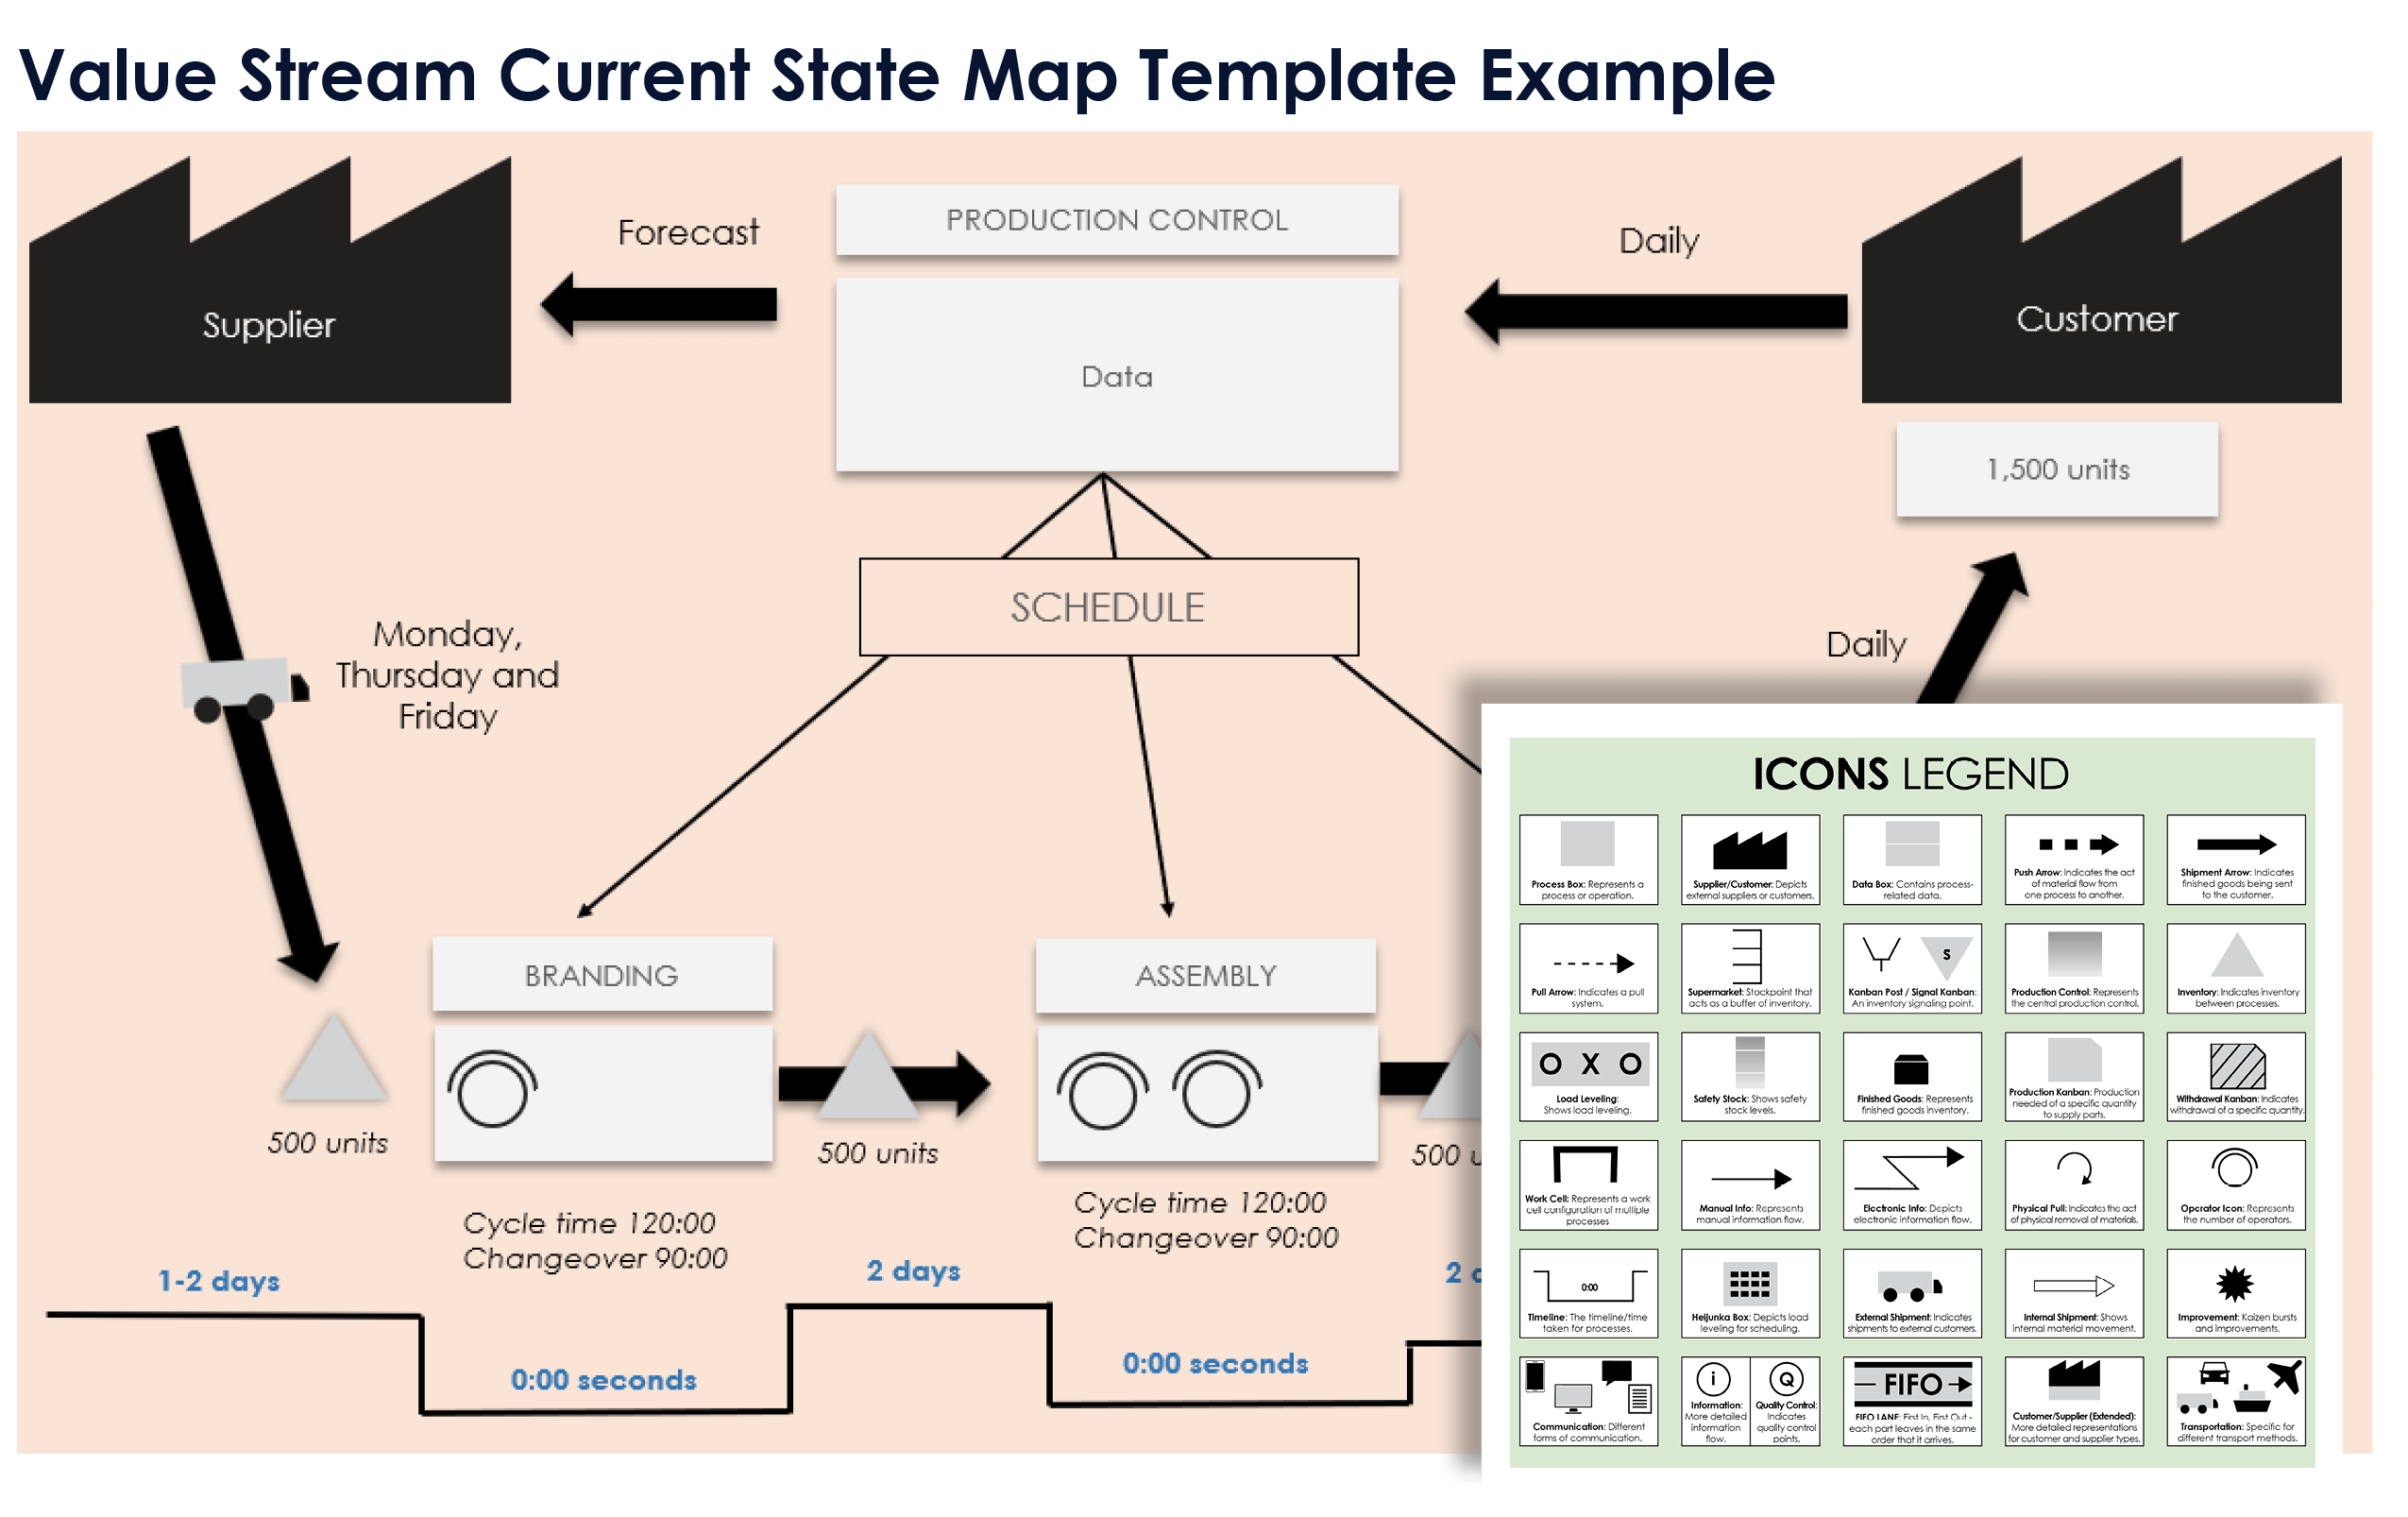
When to Use This Template: A value stream current state map template enables you to track the existing flow of materials and information in your process. With or without sample data, this template facilitates an analysis of current inefficiencies and provides a baseline for improvement initiatives.
Notable Template Features: This template includes sections for a detailed breakdown of each process step, inventory levels, and information flow, so you can develop a comprehensive picture of the actual conditions before making any changes. Clear symbols and layouts make it easy to determine the sources of bottlenecks and waste.
For a deeper understanding of waste reduction and process optimization methodologies, refer to this guide to Lean project management.
Value Stream Future State Map Template
Download a Blank Value Stream Future State Map Template for
Excel
|
Microsoft Word
|
PowerPoint
Download a Sample Value Stream Future State Map Template for
Excel
|
Microsoft Word
|
PowerPoint
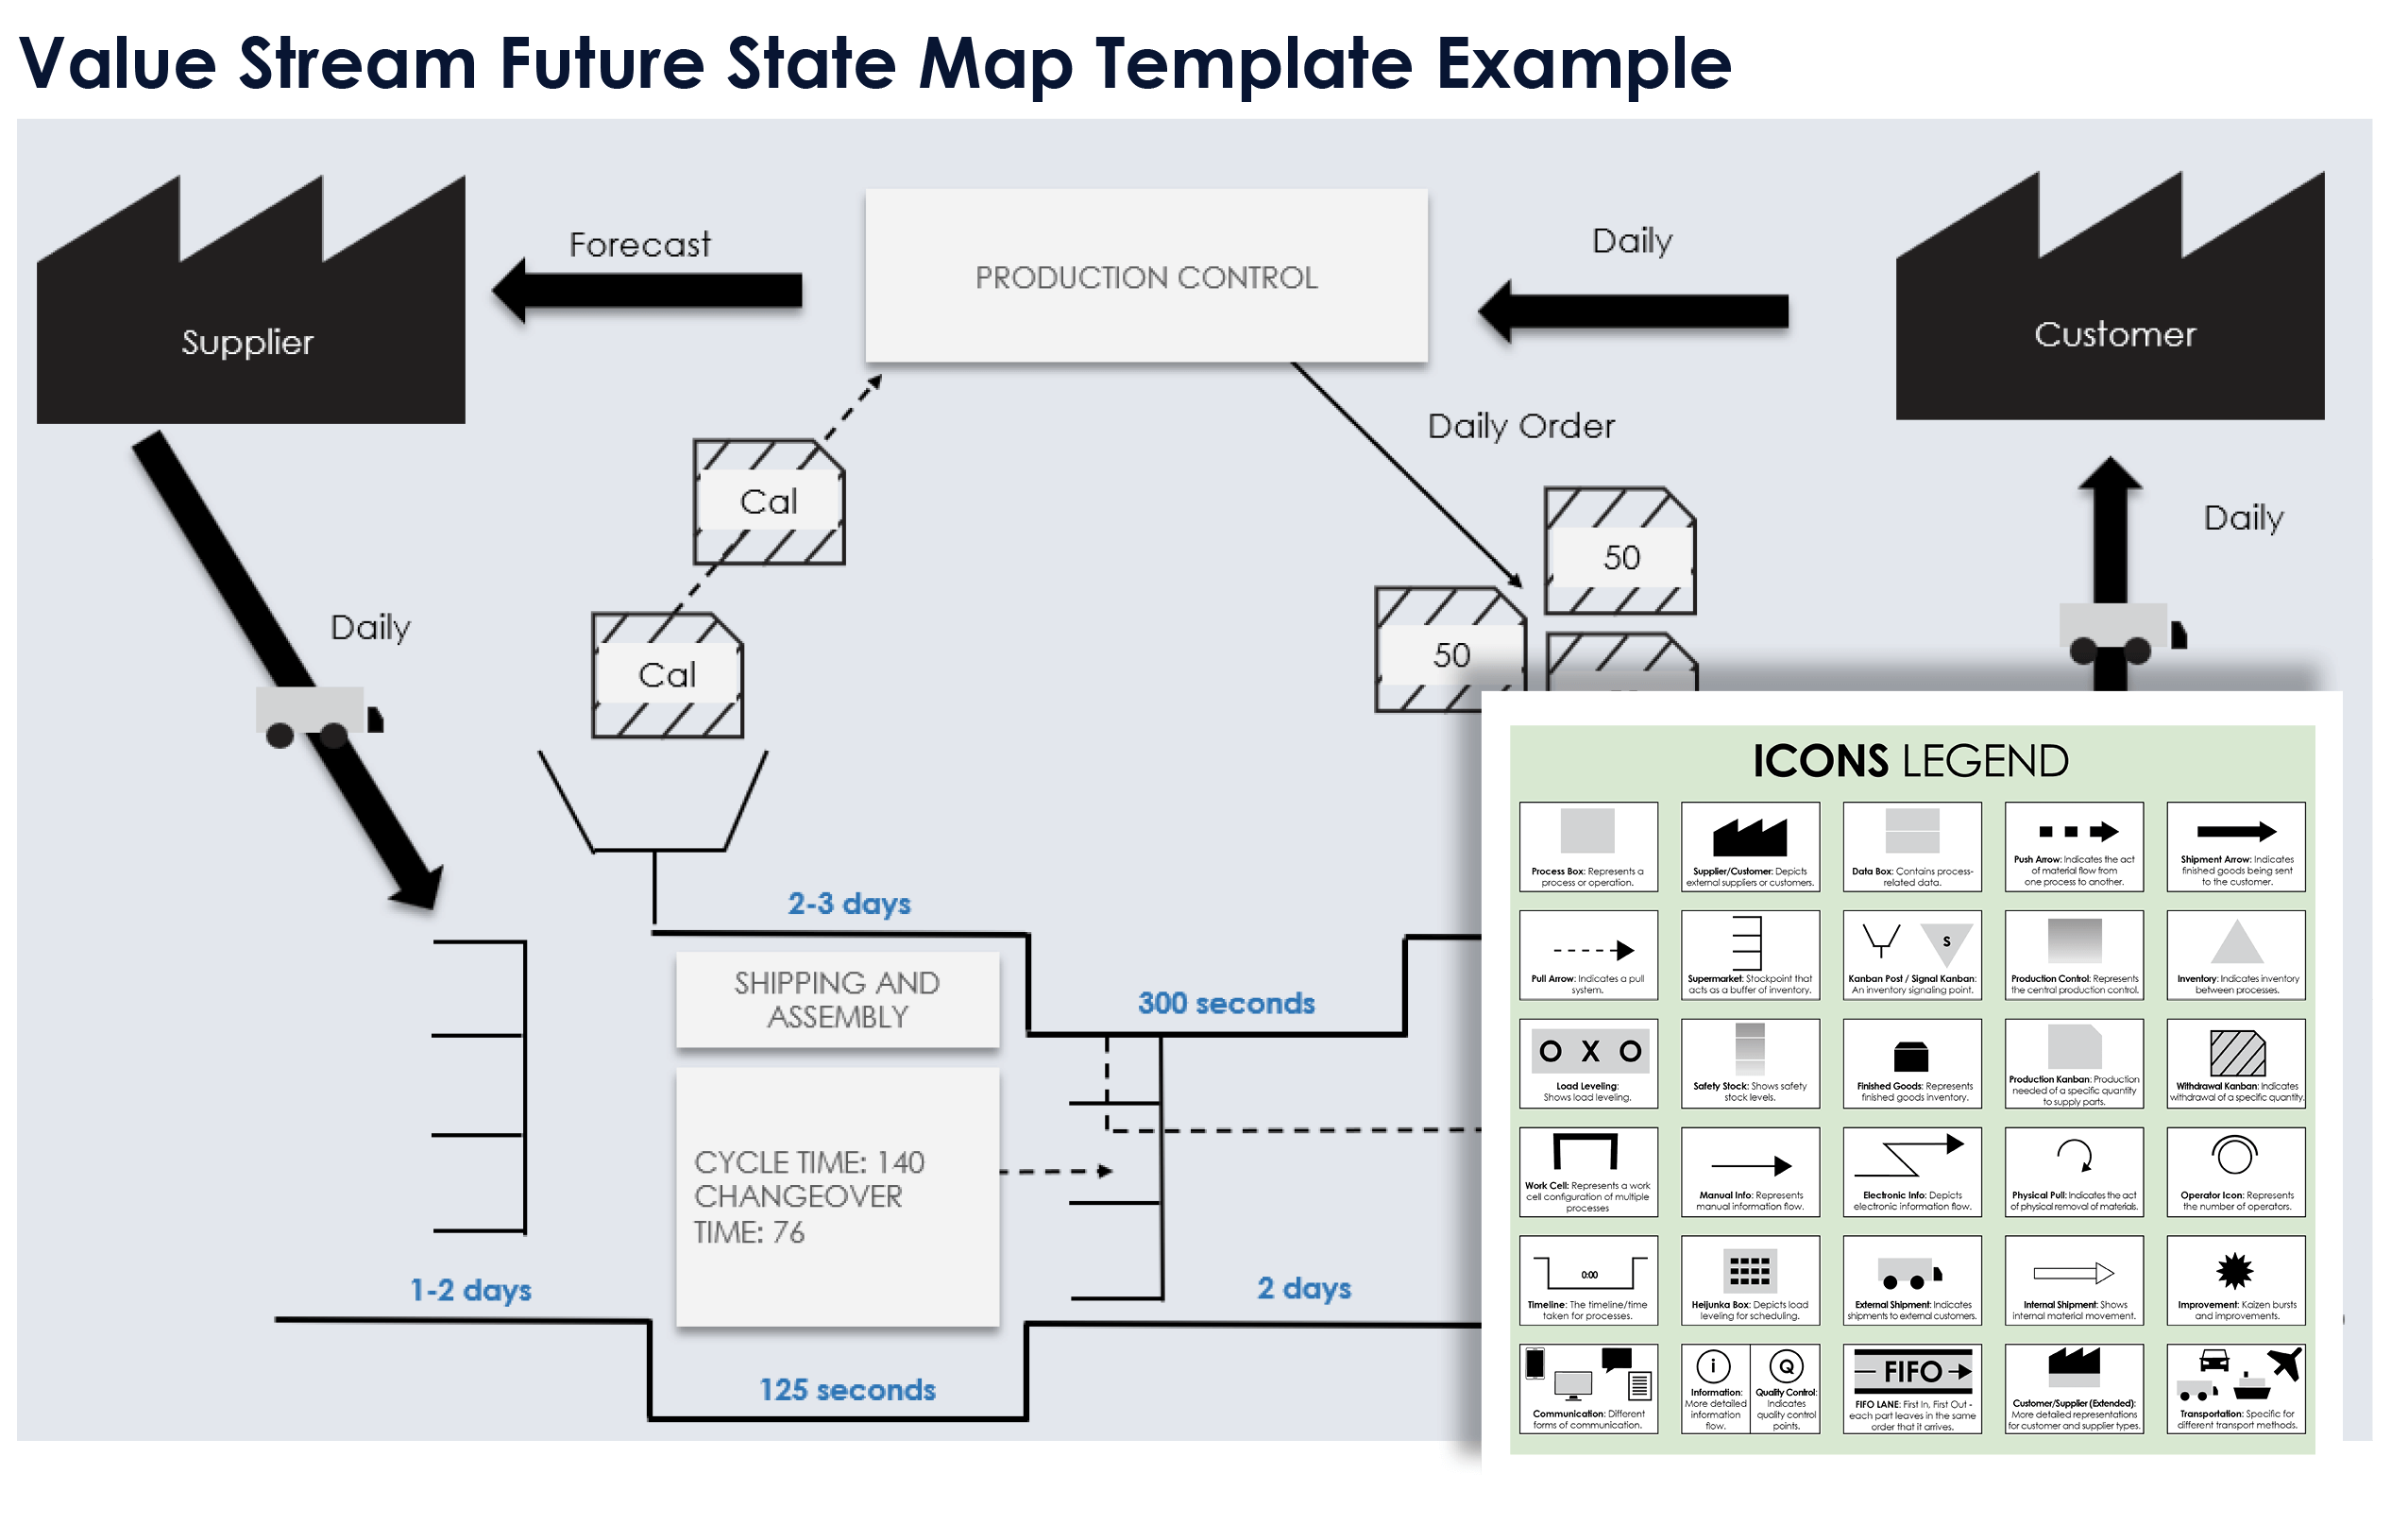
When to Use This Template: Leverage this value stream future state map template to design and plan the ideal version of your process, focusing on eliminating inefficiencies and enhancing productivity. Download the sample template for a guide to setting strategic goals and visualizing process improvements.
Notable Template Features: This template provides sections for outlining proposed process improvements, optimized inventory levels, and streamlined information flow. Detailed visual elements help convey the future state vision clearly to your stakeholders and team members.
Learn how to apply lean concepts to continuously enhance your operations with this insightful guide to Lean process improvement.
Extended Value Stream Map Template
Download a Blank Extended Value Stream Map Template for Excel
Download a Sample Extended Value Stream Map Template for Excel
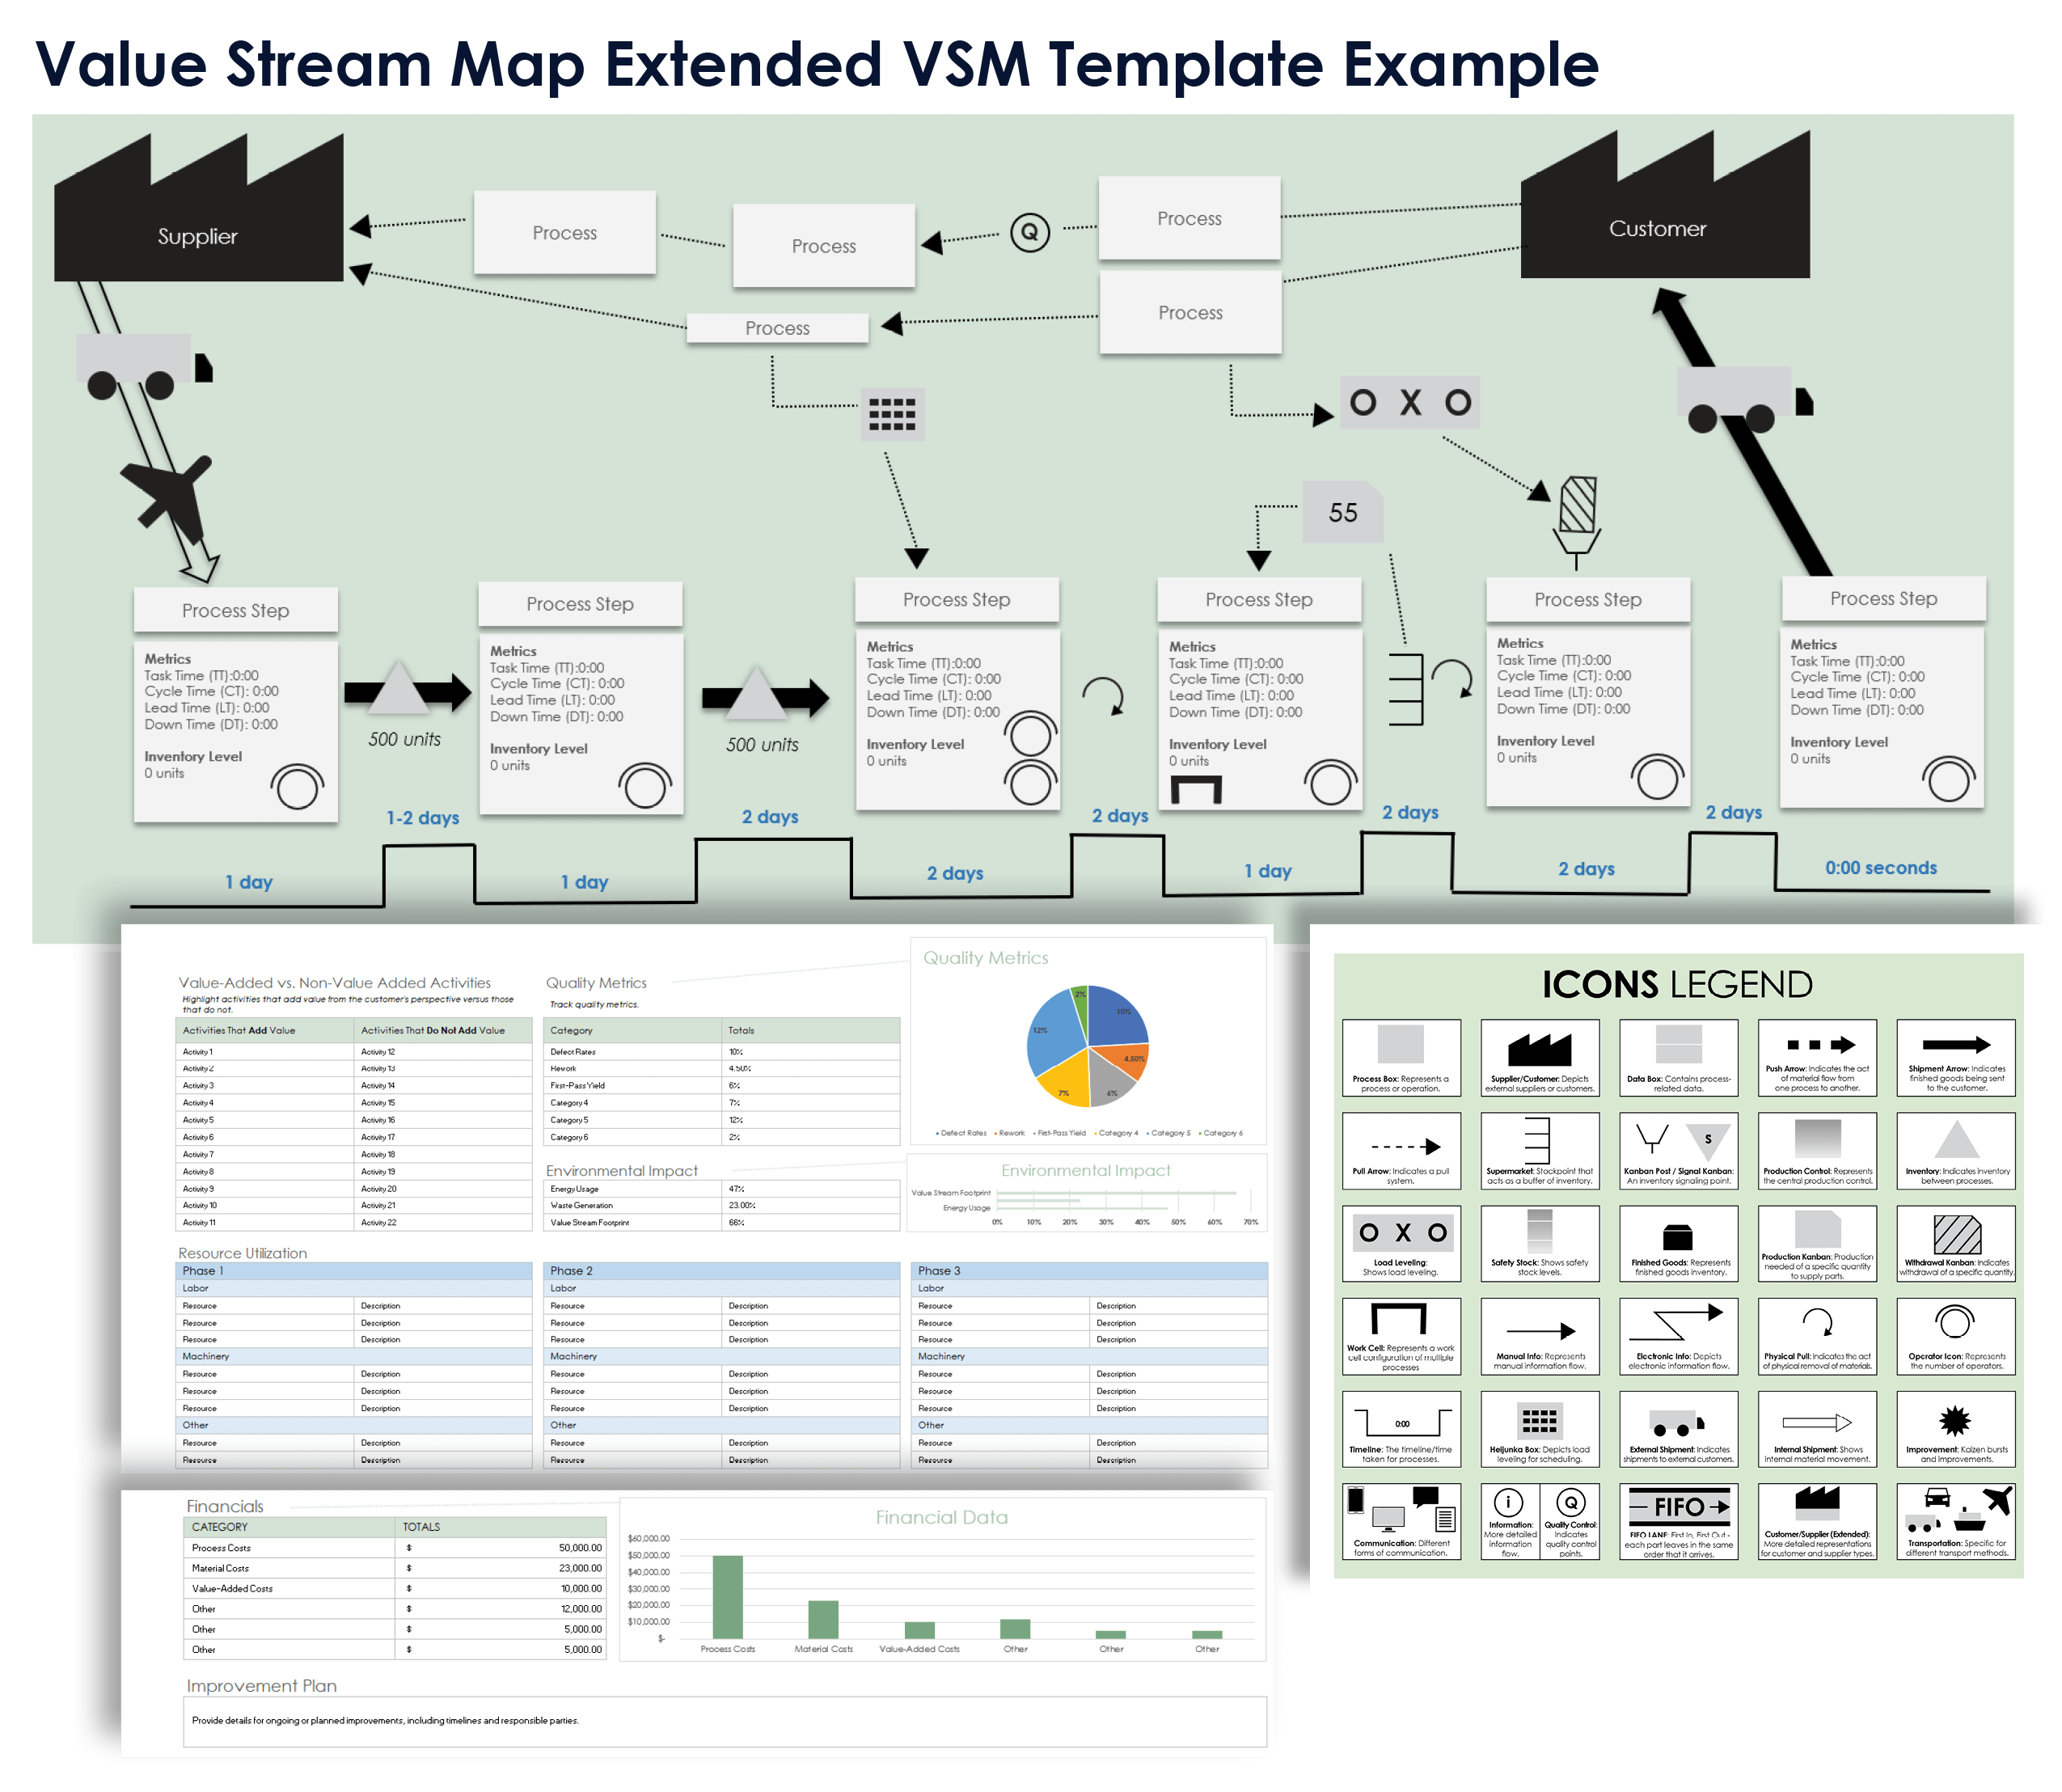
When to Use This Template: This extended value stream mapping template is an effective tool for analyzing your process in depth, incorporating advanced metrics and visual aids. Available with or without sample data, this template is ideal for teams looking to gain a thorough understanding of workflow efficiency and capacity.
Notable Template Features: This template’s advanced features include a pie chart to help you visualize the proportion of value-added time in your process, as well as vertical bar charts for evaluating workload distribution, capacity, and costs of process steps. These detailed, customizable tools enable precise tracking and analysis of multiple aspects of your value stream, providing actionable insights for improvement.
Discover how to optimize your workflow and boost productivity in this guide on how to win with Lean management.
SIPOC VSM Template
Download a Blank SIPOC VSM Template for
Excel
|
Microsoft Word
|
PowerPoint
| Google Sheets
Download a Sample SIPOC VSM Template for
Excel
|
Microsoft Word
|
PowerPoint
| Google Sheets
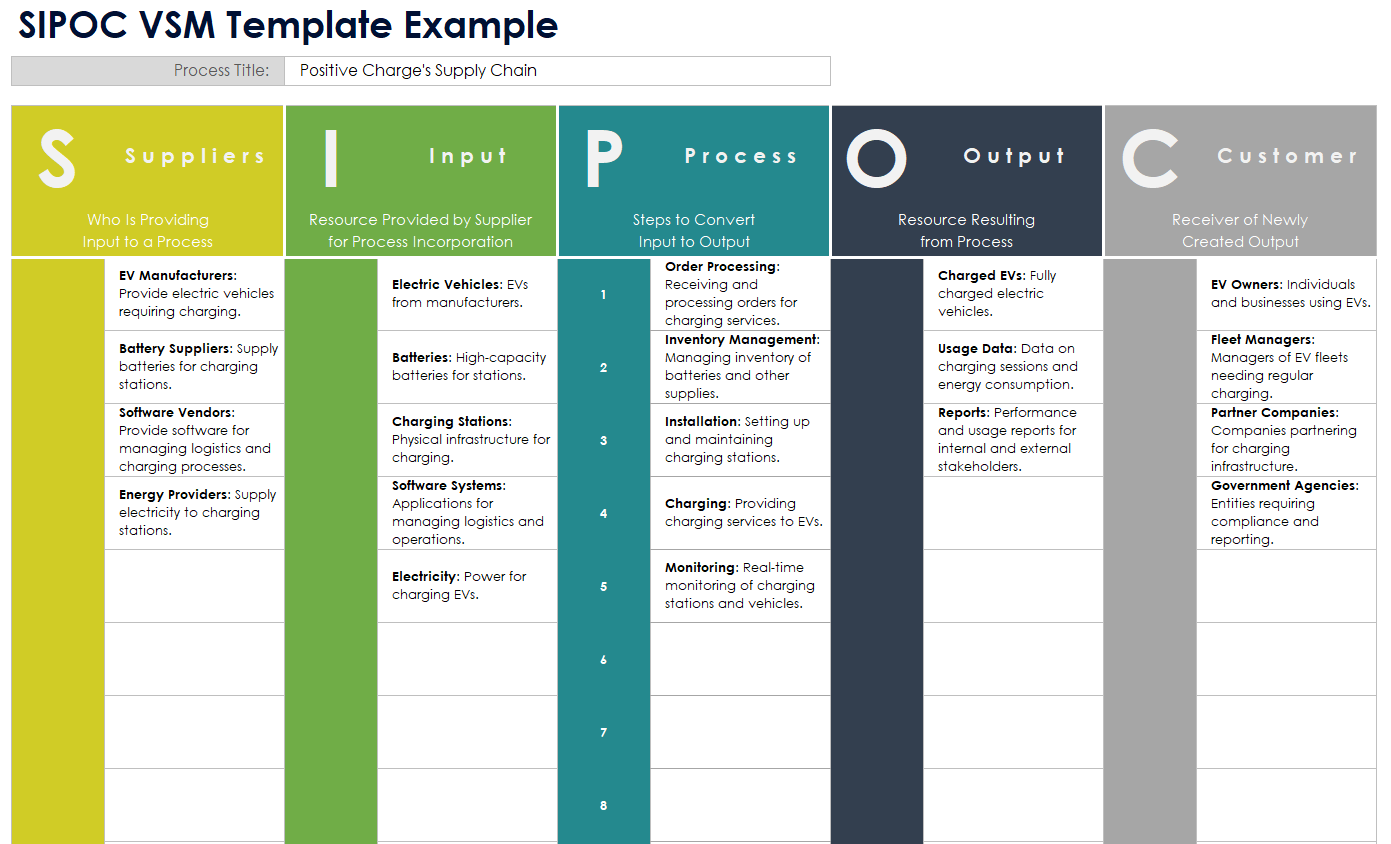
When to Use This Template: Use this supplier-input-process-output-customer (SIPOC) VSM template to get a high-level overview of your process by mapping out its key elements — from where materials originate to how they are transformed and who receives the final product. This template with or without sample data is particularly useful as a starting point for detailed value stream mapping, when you need to align team members on the scope and flow of the process.
Notable Template Features: This template offers sections for defining the suppliers, inputs, processes, outputs, and customers that make up your operation, providing a clear structure for your value stream. The template helps you visualize the entire workflow, understand the relationships between stages, and identify gaps in the process.
Value Stream Map Swimlane Diagram Template
Download a Blank Value Stream Map Swimlane Diagram Template for
Excel
|
Microsoft Word
|
PowerPoint
Download a Sample Value Stream Map Swimlane Diagram Template for
Excel
|
Microsoft Word
|
PowerPoint
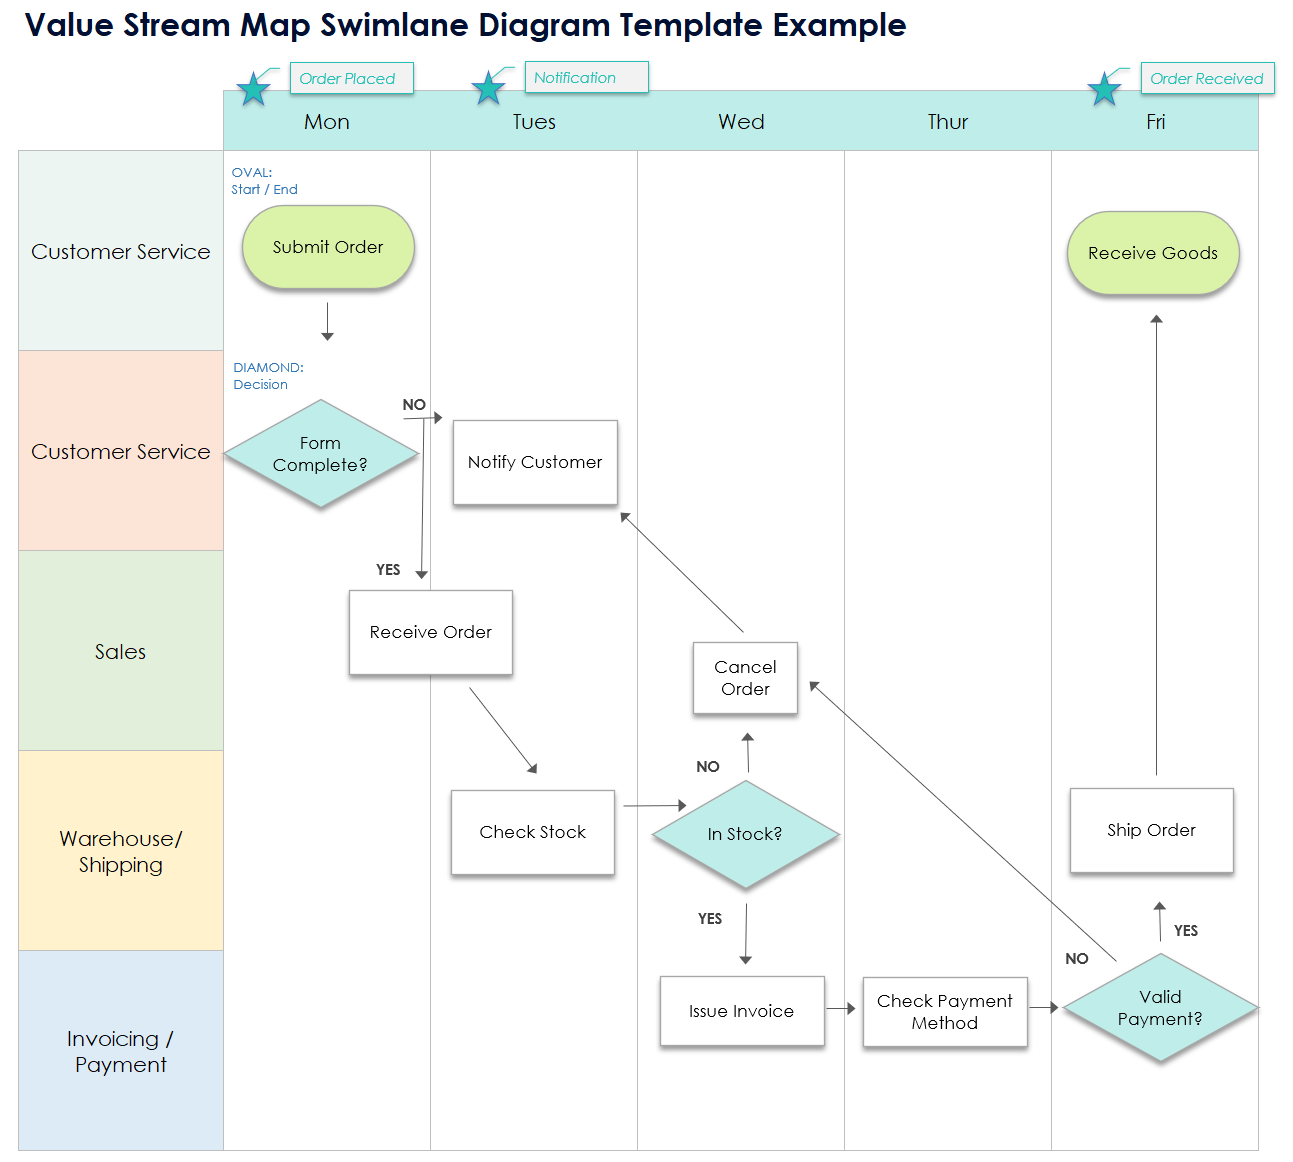
When to Use This Template: Use this value stream map swimlane template to clearly delineate responsibilities across different departments (e.g., customer service, sales, shipping, and accounting). Download the version with sample data to see how this template facilitates efficient departmental handoffs and interactions.
Notable Template Features: This template includes swimlanes for key departments, so you can easily track the flow of tasks and information between them. This system helps you pinpoint inefficiencies and improve coordination across the organization.
Lead Time Ladder VSM Template
Download a Blank Lead Time Ladder VSM Template for
Excel
|
Microsoft Word
|
PowerPoint
Download a Sample Lead Time Ladder VSM Template for
Excel
|
Microsoft Word
|
PowerPoint
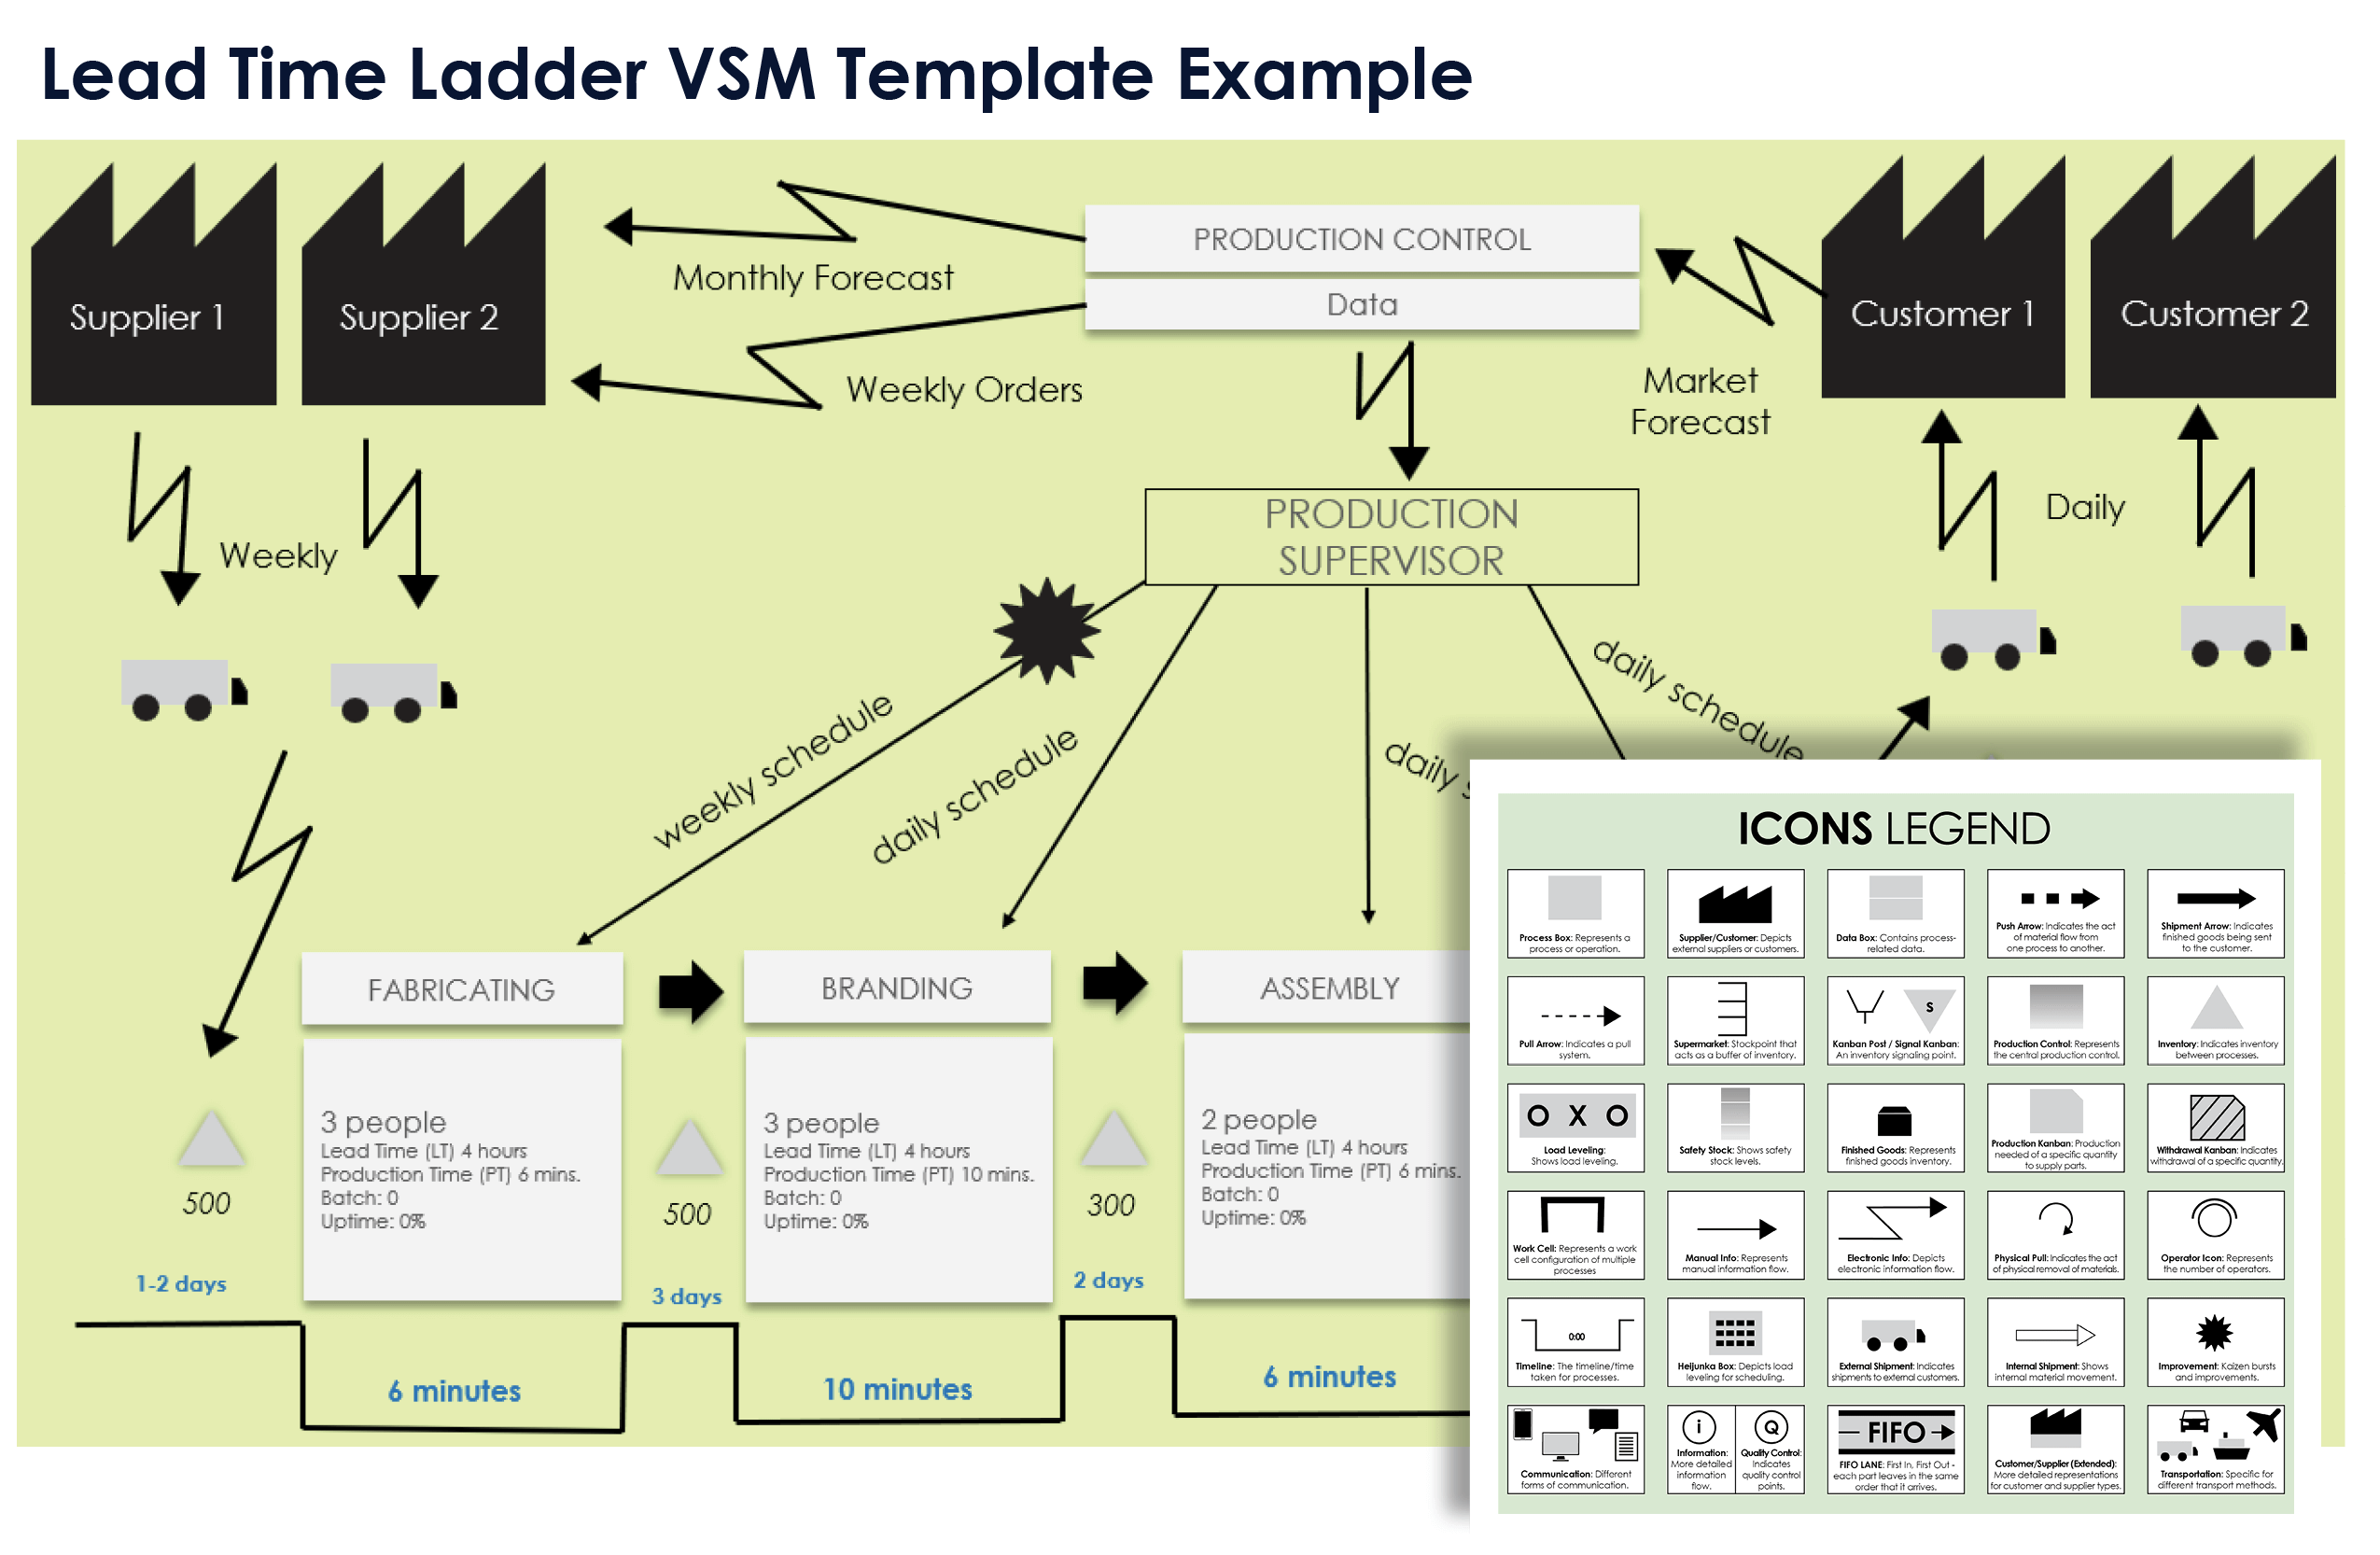
When to Use This Template: Utilize this lead time ladder VSM template to analyze and visualize how long it takes to move through your entire process, including work time and waiting time. Available with or without sample data, this template is an effective tool for identifying delays and opportunities to reduce cycle times.
Notable Template Features: This template facilitates a detailed breakdown of lead times across different stages, enabling you to understand the pace of each process step and spot idle time or delays between steps. The visual ladder format makes it easy to compare lead times and prioritize improvements for faster overall process flow.
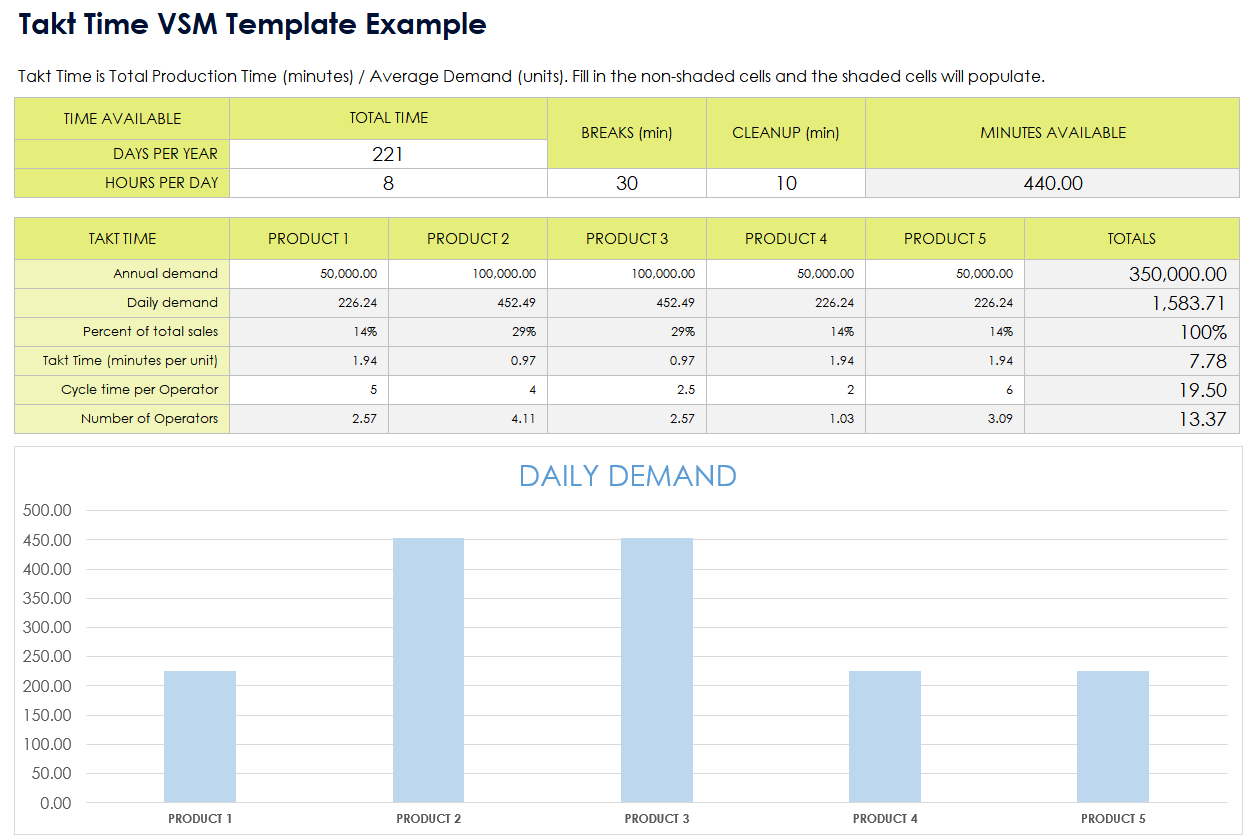
Takt Time VSM Template
Download a Blank Takt Time VSM Template for
Excel
|
Microsoft Word
| Google Sheets
Download a Sample Takt Time VSM Template for
Excel
|
Microsoft Word
| Google Sheets
When to Use This Template: Employ this takt time VSM template when you need to synchronize production pace with customer demand and ensure your processes satisfy the market needs. Download the version with sample data for pointers on achieving a balanced, customer-focused workflow and optimizing production efficiency.
Notable Template Features: This template includes sections for calculating takt time, mapping process steps, and aligning production activities to meet demand rates. The visual representation highlights bottlenecks and imbalances, so you can allocate resources efficiently to maintain a steady workflow.
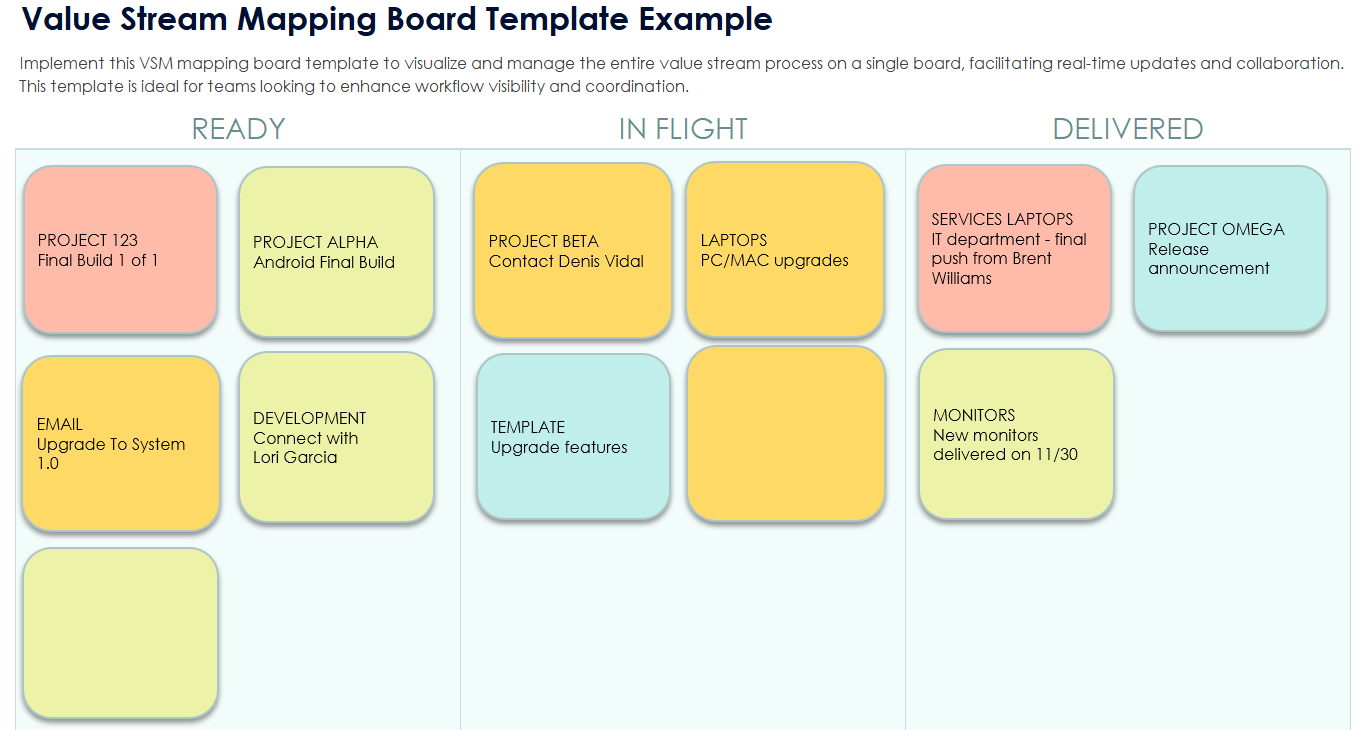
Value Stream Mapping Board Template
Download a Blank Value Stream Mapping Board Template for
Excel
| Google Sheets
Download a Sample Value Stream Mapping Board Template for
Excel
| Google Sheets
When to Use This Template: Leverage this value stream mapping board template to visually organize and manage VSM activities on a board, moving tickets across Ready, In Flight, and Delivered columns. This template with or without sample data is ideal for facilitating team collaboration and providing real-time updates during process improvement sessions.
Notable Template Features: This template includes columns for categorizing tasks as Ready, In Flight, and Delivered, so you can track their progress through the value stream. The interactive board format allows you to make dynamic adjustments, enhancing team communication and engagement.