Critical Path Method Example
The critical path method (CPM) is a project modeling technique that helps teams identify the sequence of crucial, interdependent tasks in a project. See how CPM helps you prioritize tasks and manage time with this promotional video production project example.
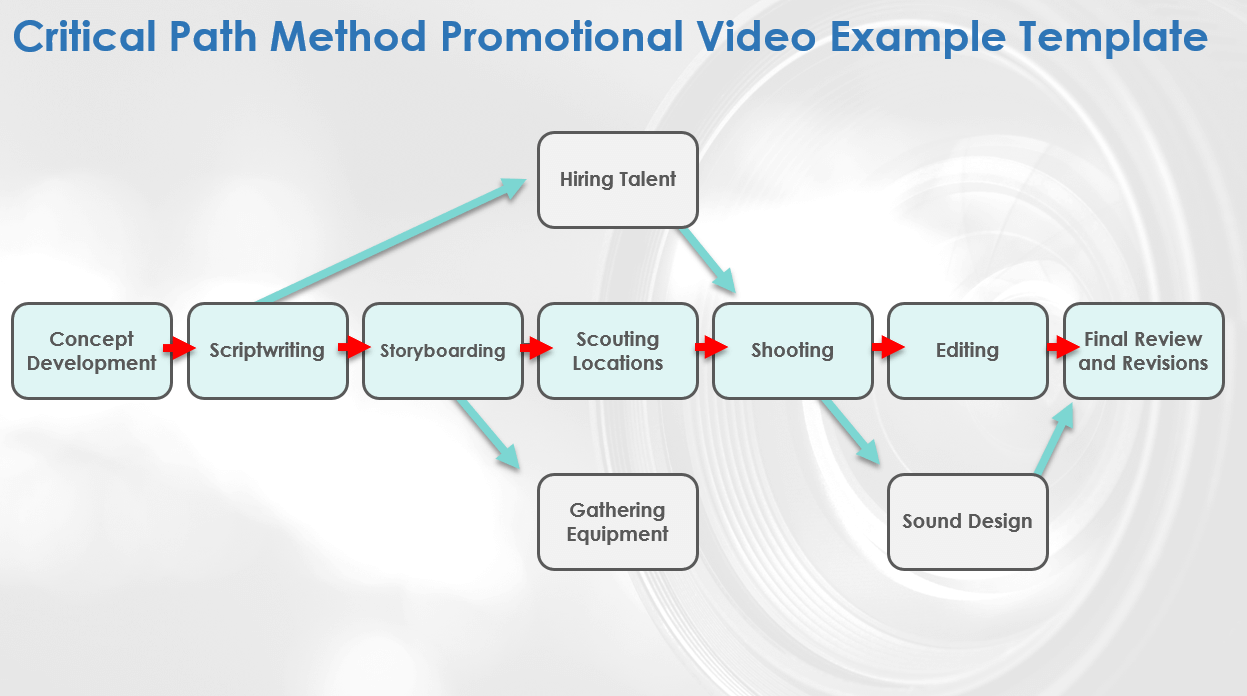
Critical Path Method Promotional Video Example Template for PowerPoint
In this downloadable, slide-format example, the critical path is the sequence of tasks highlighted by the red arrows. The tasks on that path (concept development, scriptwriting, storyboarding, location scouting, shooting, editing, and final review and revisions) define the project’s shortest possible duration. The other tasks (hiring talent, gathering equipment, and creating sound design) are important but offer more flexibility in scheduling.
Based on this CPM chart, producers can make more informed decisions so that they can deliver a high-quality video on time:
- Resource Allocation: Allocate the most skilled resources to critical tasks, such as scriptwriting, storyboarding, and editing, to ensure quality and adherence to the schedule.
- Task Sequencing: Schedule dependent tasks — such as hiring talent and gathering equipment — to begin only after the preceding tasks of scriptwriting and storyboarding are complete, while also preparing for scouting locations that can run in parallel to minimize waiting periods.
- Buffer Management: Include buffers for the shooting and editing phases to account for potential overruns, as these are complex tasks with high impact on the final delivery date.
- Risk Assessment: Prioritize risk assessment and mitigation for the tasks on the critical path because any delay in these areas could lead to project delays.
To learn everything you need to know about CPM, including the history of CPM and step-by-step how-to guides, see this beginner’s guide to CPM.
Critical Path Analysis Example
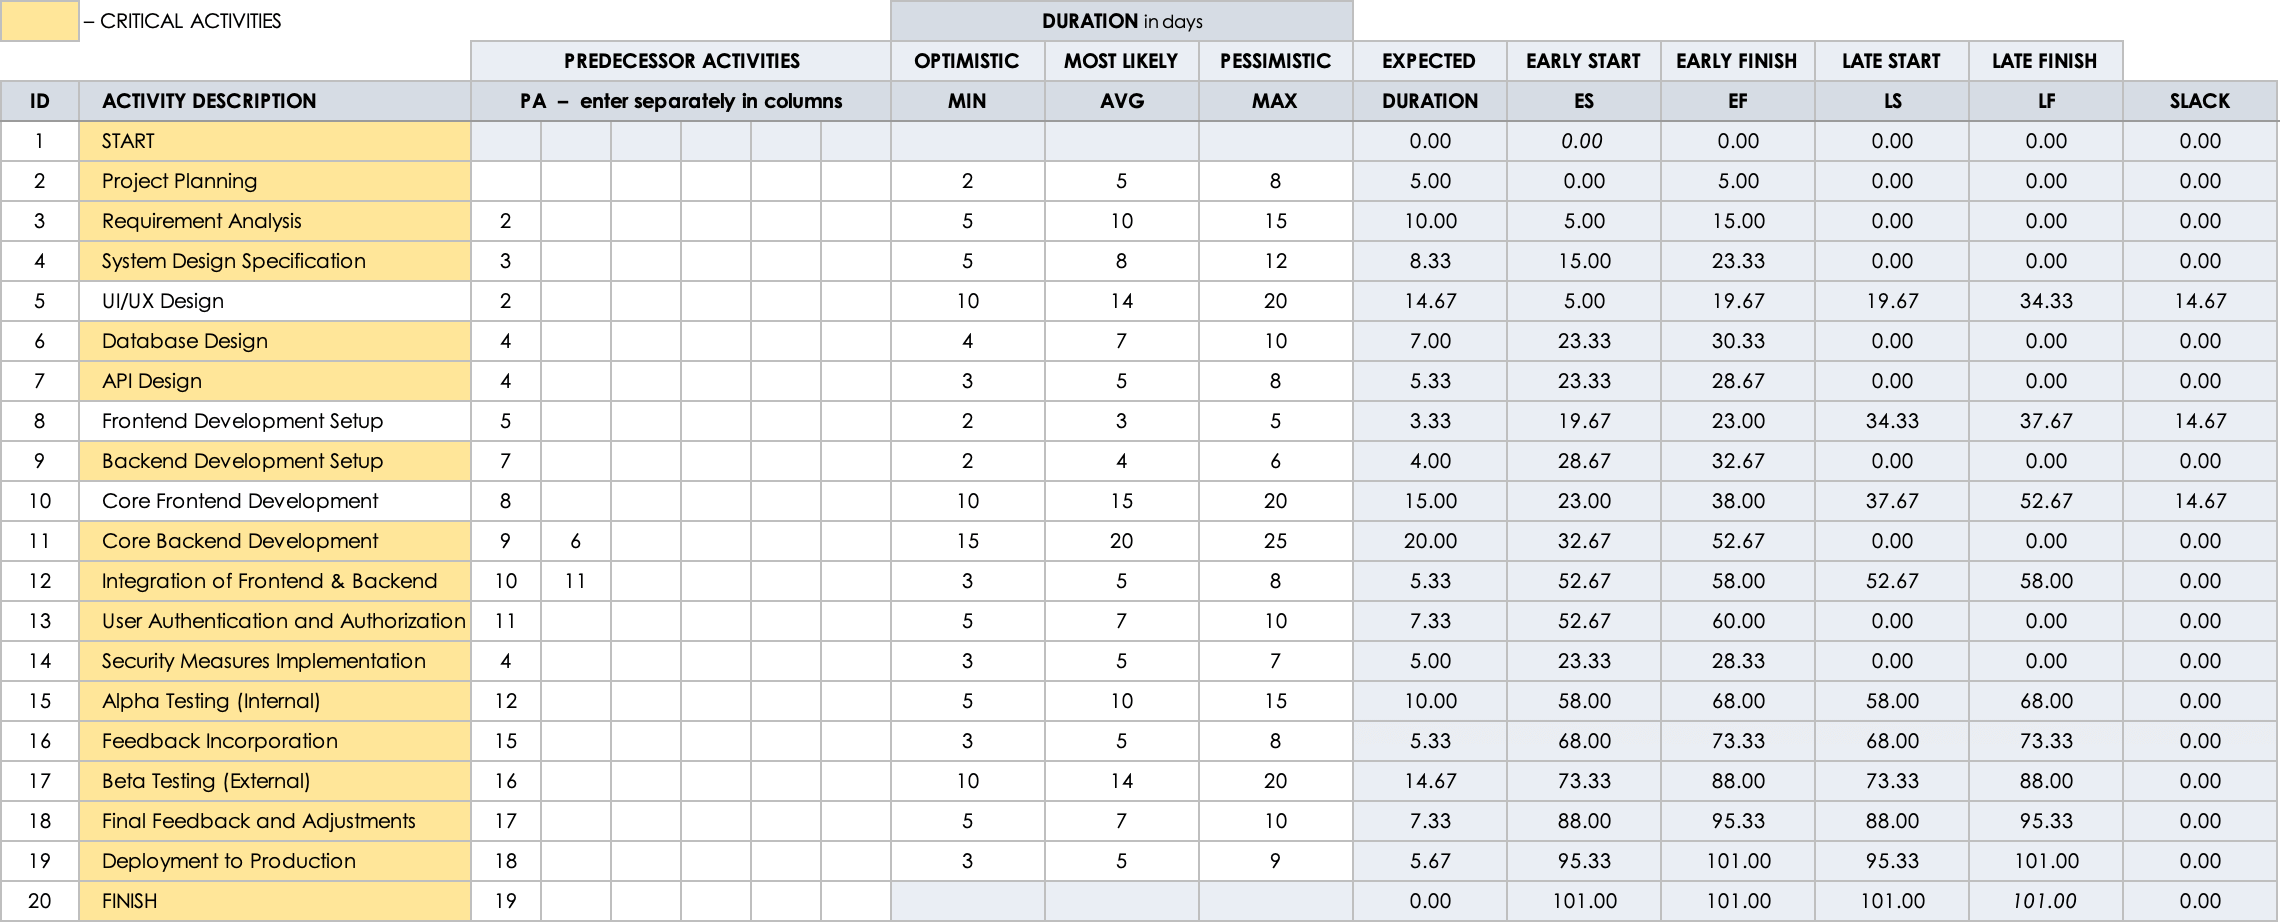
Critical path analysis involves mapping all project activities with their dependencies and durations. In this example software engineering project, you get more accurate time estimates by breaking larger tasks into smaller components, such as creating a new feature.

“In the software development industry, CPM is invaluable for managing complex projects with interdependent tasks,” says Vladimir Terekhov, CEO of Attract Group. “It helps in accurately forecasting project timelines and preventing resource overallocation, which is particularly beneficial in our domain, where time to market can be crucial.”
As an example, imagine a project manager is overseeing the development of a new web-based task management application. They’ll need to break down a complicated project into manageable tasks, accurately estimate completion times, and identify task dependencies that could impact the project flow.
Breaking Down Tasks
- Start with the End Goal: Define what success looks like for your project. In this example project, that means a fully functional web application.
- Identify Major Phases: Divide the project into major phases, such as planning, design, development, testing, deployment, and monitoring.
- Break Down Phases into Tasks: Further break down these phases into specific tasks. For instance, the design phase can be divided into UI/UX design, database design, and API design.
- Define Task Dependencies: Identify how tasks are related to or dependent on each other. Some tasks can proceed in parallel, while others must wait for preceding tasks to be completed. For example, front-end and back-end development might start concurrently, but integration testing cannot begin until both parts are developed.
Estimating Time Frames
- Review Historical Data: Look at similar projects your team has completed in the past to get a baseline for how long each task might take. This historical data provides a starting point for your estimates.
- Consult Your Team Members: The individuals responsible for the tasks are your best resource for accurate estimates. For tasks outside your team’s experience, consider consulting outside experts or using industry benchmarks.
- Apply the Three-Point Estimation Technique: For each task, determine three time estimates: optimistic, most likely, and pessimistic. For instance, core back-end development for this web development project has three time estimates: optimistic (15 days), most likely (20 days), and pessimistic (25 days).
- Review and Adjust: Once you have your initial estimates, review them with your team and adjust based on feedback.
Once you break down the tasks and estimate their durations, the next step is to construct a project timeline using a Gantt chart or project management software.
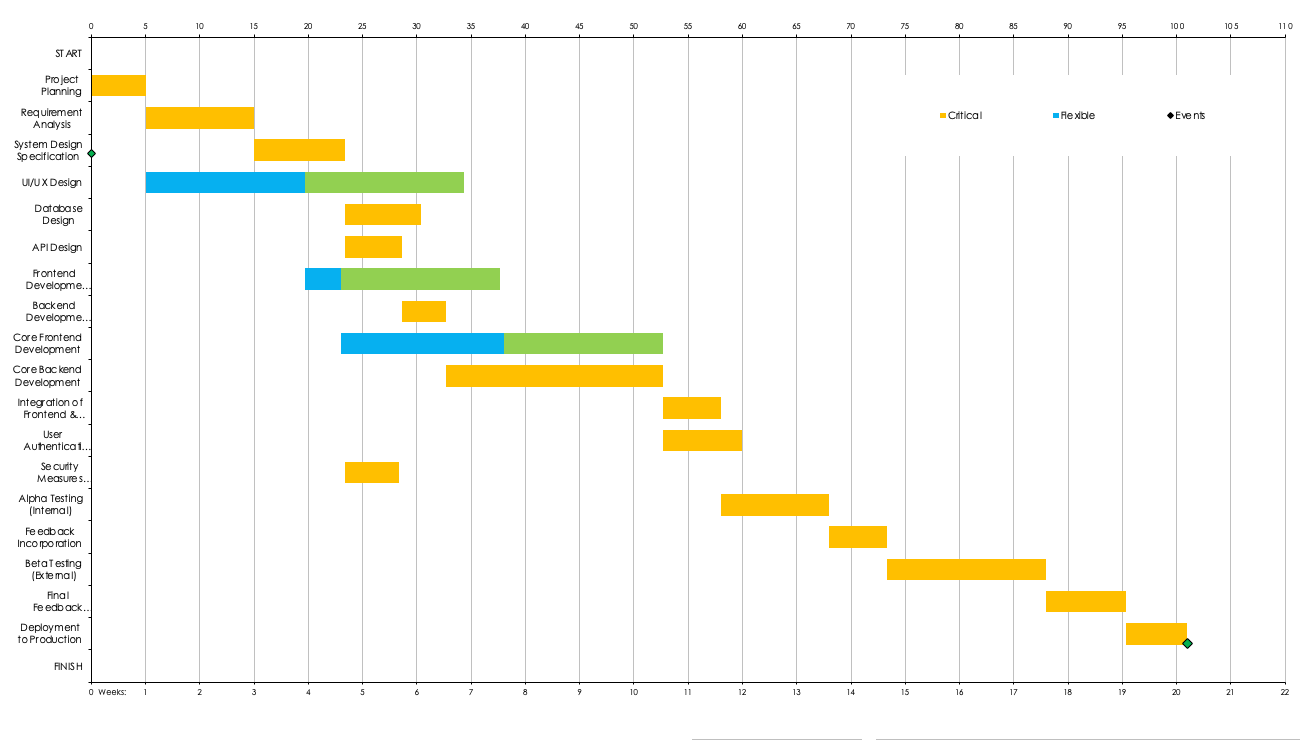
This visualization allows project managers to allocate resources efficiently, identify potential bottlenecks early, and adjust the project scope or timelines as needed.
Find and download any CPM template you might need in this collection of free critical path templates.
Critical Path Calculation Example
There are a number of calculations in CPM that are crucial for determining a project’s minimum completion time and enabling effective planning, scheduling, and resource management. In this example, a team is developing and launching a new online course platform.
In this higher education project, the team starts by breaking down the project into several manageable tasks, estimating the duration of each task, and identifying dependencies:
Task Number | Task Description | Estimated Duration | Dependences |
| 1 | Curriculum Development | 10 Days | N/A |
| 2 | Content Creation | 15 Days | Depends on Task 1 |
| 3 | Platform Update | 5 Days | N/A |
| 4 | Beta Testing | 7 Days | Depends on Task 2 and Task 3 |
| 5 | Feedback Analysis | 3 days | Depends on Task 4 |
| 6 | Final Adjustments | 4 days | Depends on Task 5 |
| 7 | Marketing Campaign | 8 days | Depends on Task 2 but can start anytime after Task 2 |
By applying all of the CPM calculations, the team can then determine the total float of each project task:
Task No. | Description | Duration | Early Start (ES) | Early Finish (EF) | Late Start (LS) | Late Finish (LF) | Total Float |
| 1 | Curriculum Development | 10 Days | 0 | 10 | 0 | 10 | 0 |
| 2 | Content Creation | 15 Days | 10 | 25 | 10 | 25 | 0 |
| 3 | Platform Update | 5 Days | 0 | 5 | 20 | 25 | 15 |
| 4 | Beta Testing | 7 Days | 15 | 32 | 25 | 32 | 0 |
| 5 | Feedback Analysis | 3 Days | 32 | 35 | 32 | 35 | 0 |
| 6 | Final Adjustments | 4 Days | 35 | 39 | 35 | 39 | 0 |
| 7 | Marketing Campaign | 8 Days | 25 | 33 | 25 | 33 | 0 |
Any task that has a total float of zero is on the critical path. Therefore, the critical path of this project includes curriculum development, content creation, beta testing, feedback analysis, final adjustments, and the marketing campaign.
The platform update is not on the critical path because it has a total float of 15 days.
Critical Path Calculation Cheat Sheet
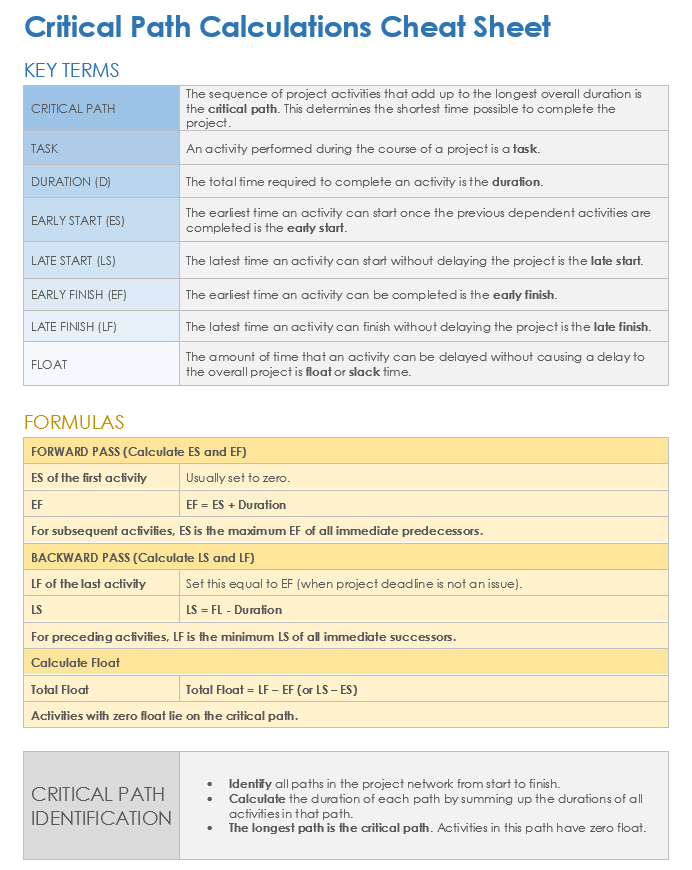
Critical Path Calculation Cheat Sheet for Microsoft Word
This critical path calculation cheat sheet is a great tool for project managers, planners, and team leaders engaged in complex projects across industries such as construction, IT, and education, where precise scheduling and resource allocation are crucial. Start by listing all project tasks, their durations, and dependencies. Then, apply the cheat sheet formulas to calculate early and late start and finish times, as well as total floats. By doing so, you can identify the project’s critical path and potential scheduling flexibilities.
Critical Path Gantt Chart Example
Gantt charts are a great way to represent the critical path along a project’s timeline. In this critical path of a healthcare project example, a hospital network is implementing an electronic health record (EHR) system.
“One significant project where CPM was critical was the development of a healthcare application,” says Terekhov. “By identifying the critical path, we could prioritize tasks that directly affected the launch date, such as regulatory compliance checks and core feature development. Implementing CPM allowed us to adjust resources dynamically, ensuring that critical tasks had the necessary manpower without overextending our capacity.”
Projects like this are complex and require many steps, from hardware and software acquisition to system integration testing and end-user training sessions. Start by mapping out each step, estimating task durations, and calculating the slack or float for each task.
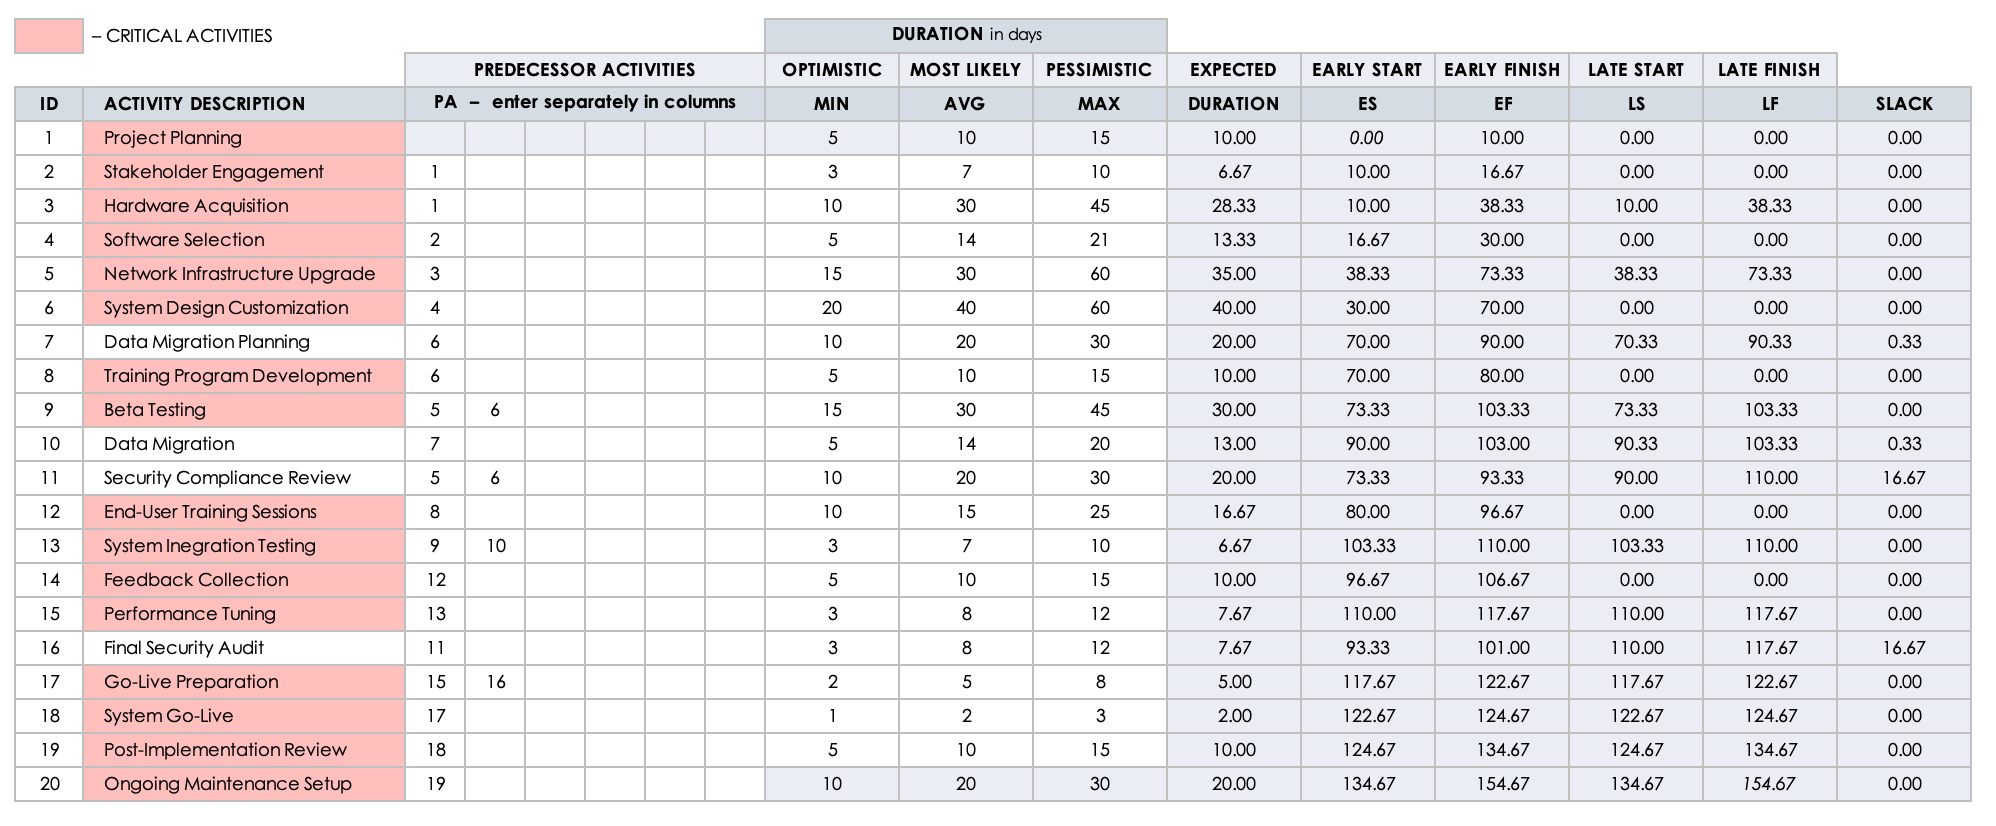
Tasks on the critical path have no slack. Using this information, you can then create a Gantt chart. Use color-coding to indicate paths on the critical path for quick and easy identification.
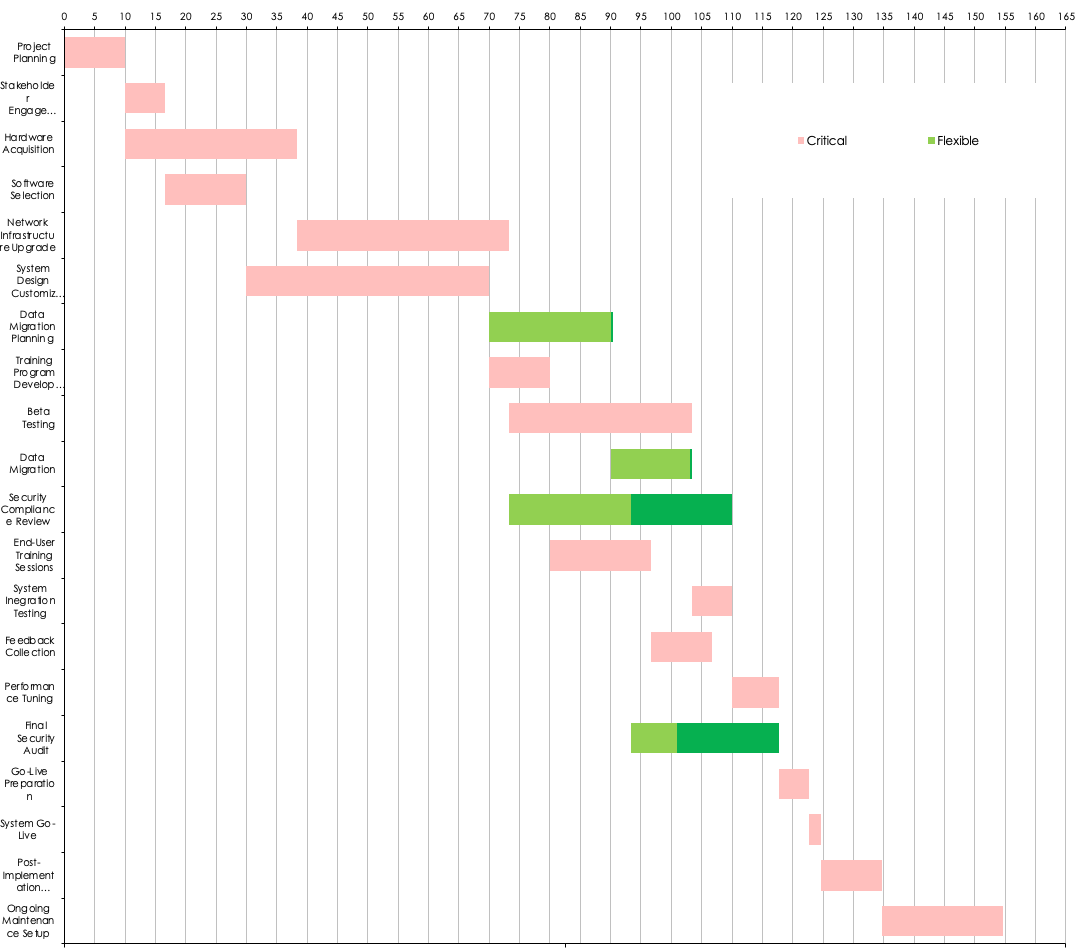
In this project, tasks such as training program development, feedback collection, and system go-live are all on the critical path and are represented on the Gantt chart in pink. Tasks such as data migration planning and the final security audit have some slack time, meaning they can be delayed without delaying the overall duration of the project. These tasks are represented in the Gantt chart in green.
Learn more about representing the critical path on Gantt charts in this article on Gantt charts and the critical path method.
Critical Path Method Scheduling Example
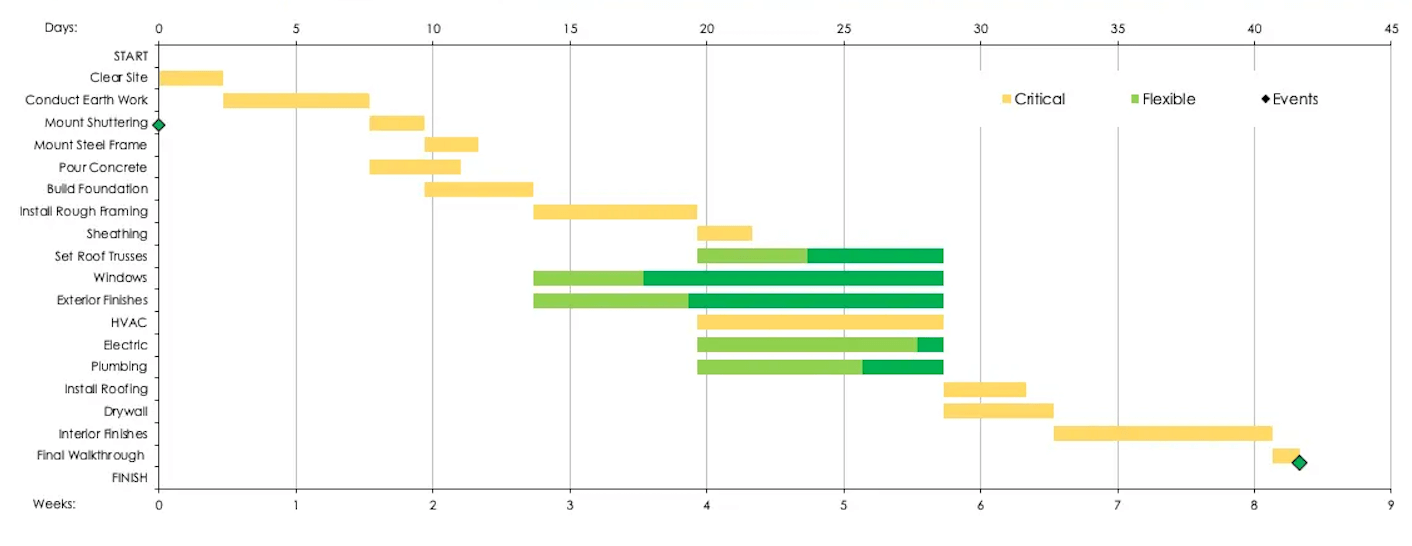
In the following construction project, the project manager uses CPM to schedule activities in a sequence that avoids delays of tasks on the critical path. This is especially important for construction projects, where delays can be costly and breach contracts.
In the following sample data set, see how this color-coded Gantt chart clearly organizes tasks so that anyone can identify the critical path at a glance. In this example, installing windows, electric, and plumbing can all be delayed without impacting the final delivery date for the project.
"Comparing projects managed with and without CPM, the difference is stark,” says Terekhov. “Without CPM, projects often face delays due to a lack of clarity on task prioritization. With CPM, there’s a structured approach, which leads to more predictable outcomes and efficient resource management.”
For more CPM resources for similar projects, see this comprehensive article on making the critical path work in construction projects.
Example of Critical Path Method in Project Management
In this project management example of the critical path method, a project manager divides tasks into four key phases of the project lifecycle: project conception and initiation, project definition and planning, project launch and execution, and project performance and monitoring.

In this example, the project manager also indicates the status of each task, so they can monitor project progress and flag any delays that might impact the overall delivery time.
Critical Path PERT Example
In this example data set, a project manager uses the program evaluation and review technique (PERT) to aid in scheduling a project. By calculating the expected time for each task, they can identify all tasks on the critical path.
PERT is useful for projects where the duration of tasks is highly uncertain. For each task, make three time estimates: optimistic, most likely, and pessimistic. The PERT calculation for expected time weights more heavily the most likely time by using the following formula:
TE = (O+4M+P) / 6
| Task | Dependencies | Optimistic Time (O) | Most Likely Time (M) | Pessimistic Time (P) | Expected Time (TE) |
| 1 | None | 1 | 3 | 5 | 3 |
| 2 | None | 1 | 2 | 3 | 2 |
| 3 | Tasks 1 and 2 | 7 | 9 | 11 | 9 |
| 4 | None | 7 | 10 | 13 | 10 |
To determine the tasks on the critical path, simply identify all possible paths through the project and calculate the total expected time for each:
Path 1 = Task 1 + Task 3 = 3 + 9 = 12 days
Path 2 = Task 2 + Task 3 = 2 + 9 = 11 days
Path 3 = Task 4 = 10 = 10 days
In this example, the critical path is Path 1 because it has the longest total duration (12 days).
Learn more about using these tools in this guide to optimizing project scheduling by combining PERT and CPM.
Critical Path Diagram Example
With the same data set used to calculate estimated times in PERT, a project manager can map a critical path diagram. This allows any stakeholder to understand the paths through a project at a glance.
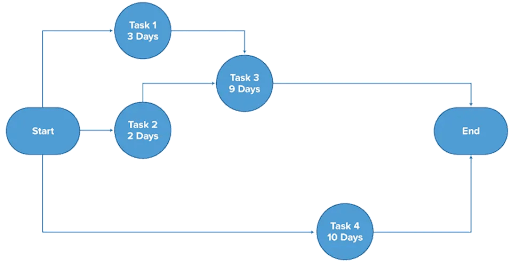
For simple projects such as this one, you can draw network diagrams by hand. For a more complicated project, try a critical path diagram template.
Critical Path Diagram Template
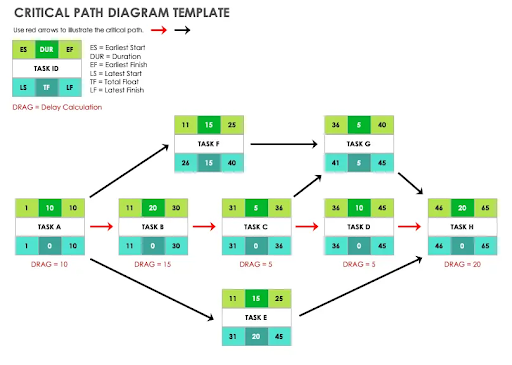
Download a Critical Path Diagram Template for
This critical path template offers a detailed network diagram with nodes that outline the task name, earliest and latest start and finish times, duration, and total float. To use the template, simply enter your data into each task box, and drag and resize the arrows to depict task sequences. To add more tasks or arrows, copy and paste from the key in the upper-left corner of the template. Highlight the critical path using the bright red arrows so that critical path tasks are easy to identify at a glance.
Critical Path of a Project Example
In the following marketing project example, a CEO shares how identifying the critical path has been crucial to her company’s success. In her media monitoring platform launch, she used CPM to anticipate market demand and execute a smooth product launch.
“My hands-on experience launching marketing campaigns and PR initiatives has solidified my appreciation for CPM,” says Alison Lancaster, Co-Founder and CEO of Pressat. “One standout project was the launch of our innovative media monitoring platform. As a data-driven company, it was crucial that this rollout went smoothly while generating significant buzz.”

“From the outset, we mapped out every task involved: building the platform itself, crafting marketing materials, securing media coverage and partnerships, and more,” continues Lancaster. “CPM allowed us to visualize dependencies between these tasks. For example, content for press releases couldn't be finalized until the platform's key features were locked in by our developers."
Recognizing the intricate relationships between various project components was key. Lancaster underscores how CPM not only identified sequential tasks but also opened doors to strategic multitasking and efficiency improvements. “This mapping process highlighted the project's critical path,” she explains. “In our case, this involved the concurrent work on platform development and content creation, both of which are essential for creating marketing assets and making initial press outreach efforts.”
By understanding the project’s structure, Lancaster and her team were able to pinpoint where simultaneous action could propel them forward. “Our developers could laser-focus on coding the platform while the marketing team simultaneously produced compelling content without delays,” she says. “Resource allocation became streamlined and efficient.”
“Thanks to CPM’s framework,” says Lancaster, “we identified a key bottleneck early on: media training for our spokespersons was on the critical path and couldn’t be rushed. We mitigated this by scheduling intensive training sessions well in advance.”
This foresight ensured that every team member was prepared and confident, aligning their public-facing communication with Pressat’s strategic goals. “When launch day arrived, our meticulous CPM implementation paid off,” says Lancaster. “The platform released on schedule; our marketing machine was primed with drip content and tailored pitches; and media coverage rolled in from top-tier outlets.”
Critical Path Chart Example
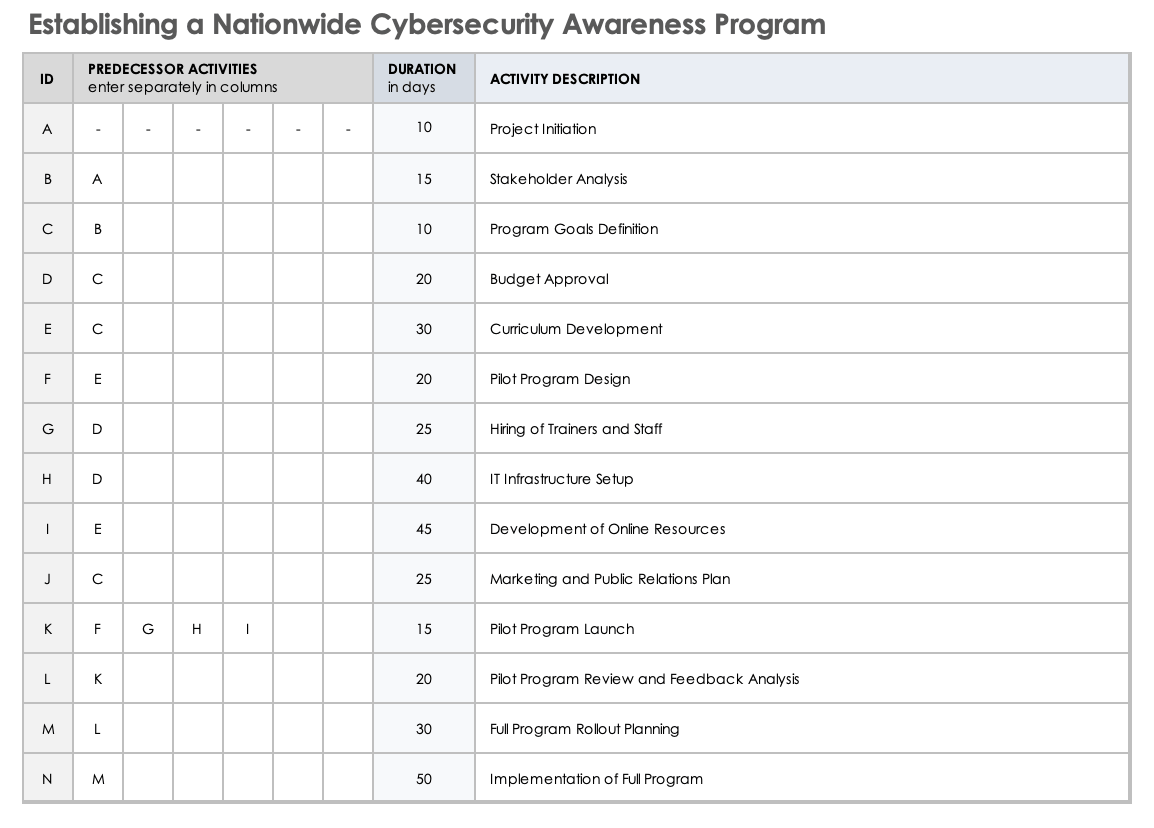
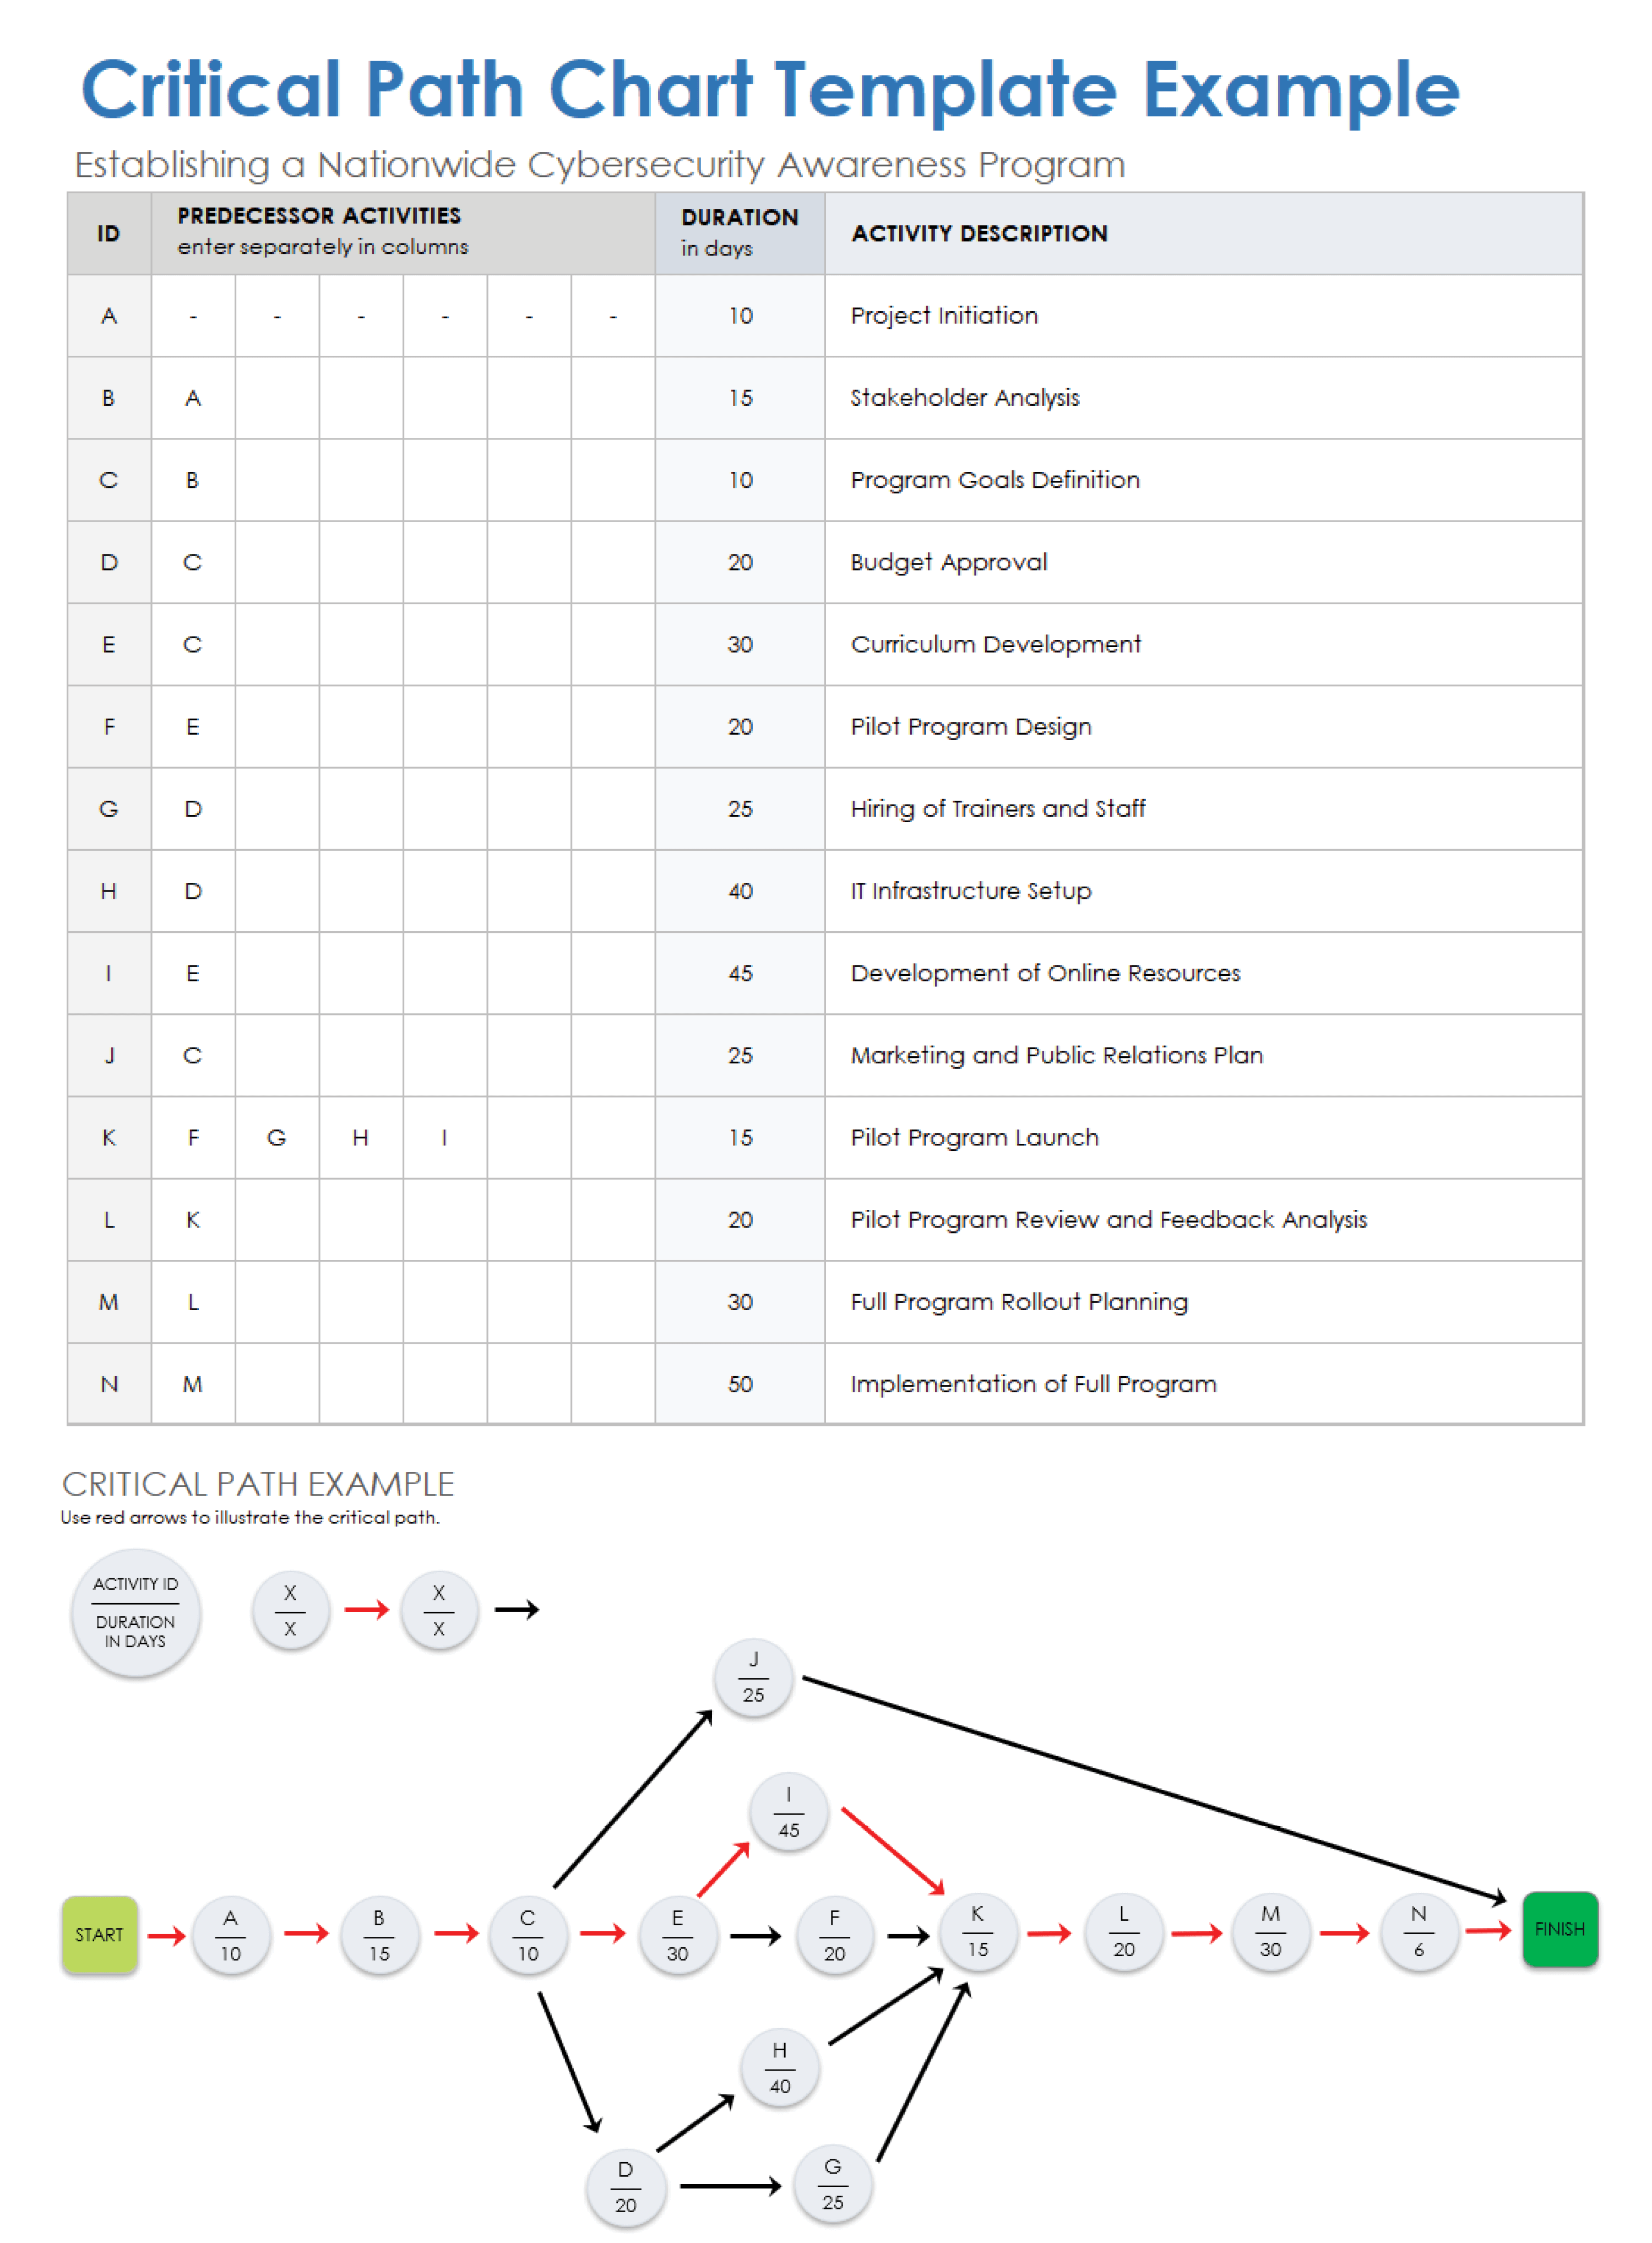
In this example federal government project, a critical path chart visually depicts the tasks needed to develop a nationwide cybersecurity awareness program. With this chart, project managers can highlight the dependencies and durations of tasks, revealing potential bottlenecks.
First, the project manager divides the project into separate tasks or activities, starting with project initiation and stakeholder analysis, advancing to the pilot program launch, and ending with the implementation of the full program. Next, they determine the task dependencies and the duration in days needed to complete each task based on historical data and team feedback.
Using all this information, the project manager can create a critical path chart, with the critical path highlighted in red:
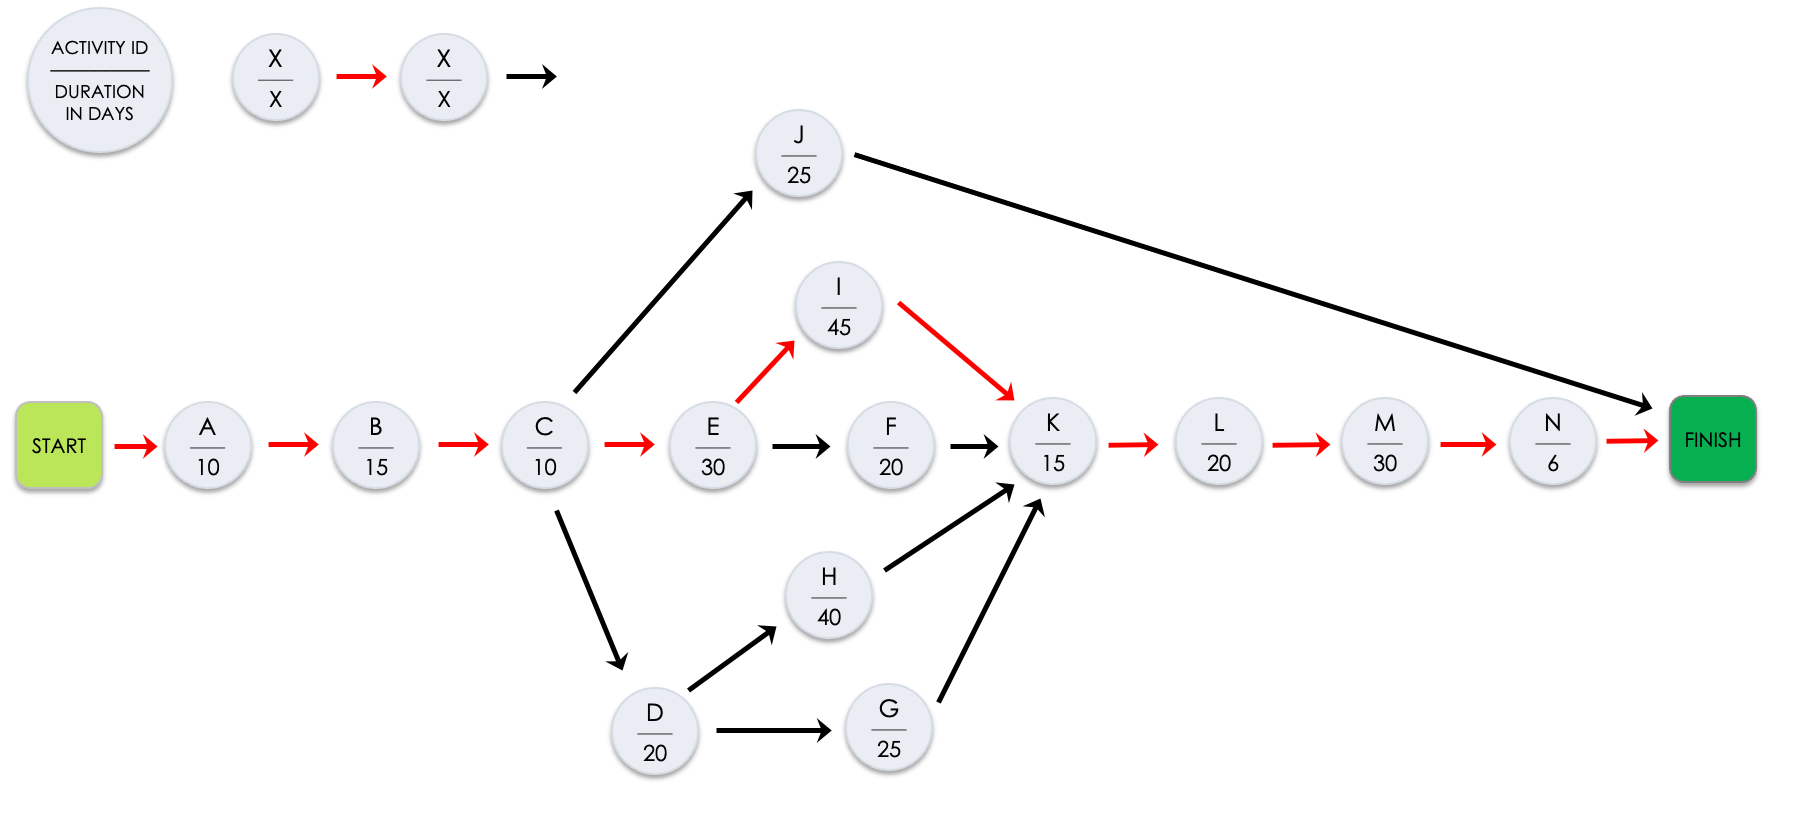
CPM charts such as this one are useful across a range of industries. Project managers can use them to schedule tasks, manage resources, and communicate scheduling information to stakeholders.
Critical Path Chart Template
Download an Example Critical Path Chart Template for
Excel
|
PowerPoint
Download a Blank Critical Path Chart Template for
Available with or without example text, this template is crafted for project managers, team leaders, and planners who need a visual tool to map out task sequences, durations, and critical path tasks. It streamlines the identification of dependencies and key tasks that could impact the project timeline. Download the example version to view the federal government project provided above. Otherwise, you can opt for the blank template and customize it to meet your project’s needs.
Pro Tip: Lancaster shares a problem she once faced while using CPM so that others can learn from her past mistakes. “We once overlooked a crucial dependency during a social media campaign,” she says. “The client’s influencers needed to approve ad creative before we could launch. This delayed the whole campaign timeline.”
When something like this happens, project managers can course correct using CPM. “We rectified the situation by revising the CPM to account for influencer approvals, building in buffers for potential bottlenecks,” she explains. “It was a valuable lesson. Mapping dependencies thoroughly is critical when dealing with tight, interlinking schedules.”
Easily Find Your Project’s Critical Path in Smartsheet
Discover a better way to find the critical path for your project. Smartsheet’s simple, easy-to-use platform can help you find the critical path in just one click so your team can get more done, faster. Follow these steps to see the critical path for your project in Smartsheet.
- Ensure there are two columns with dates on your sheet, and select Gantt View.
- Right-click on any column header in the Gantt chart on your sheet, and select Edit Project Settings to set up dependencies.
- Use the Predecessors column to define relationships between tasks.
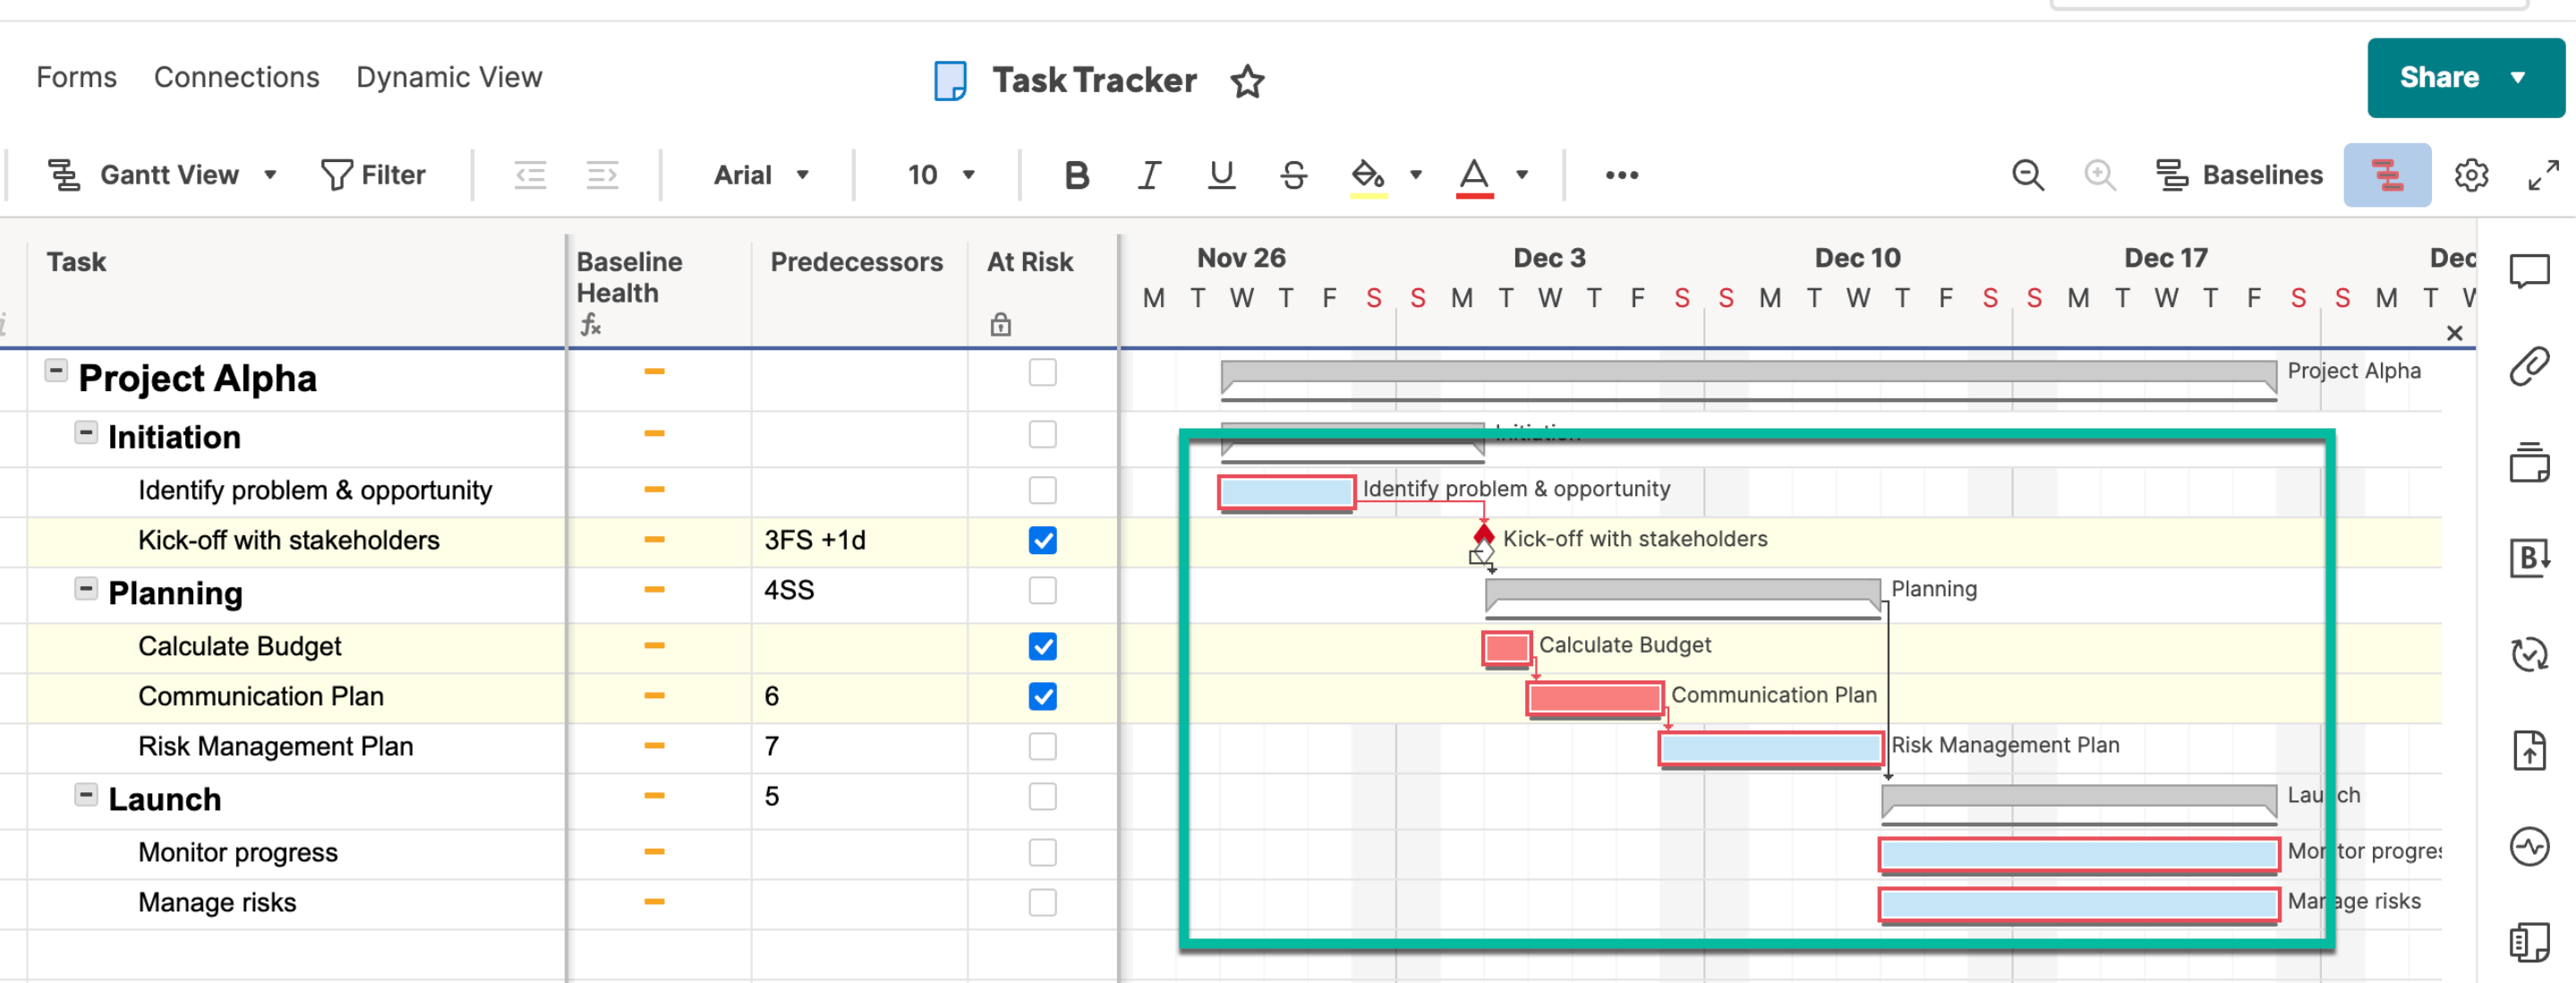
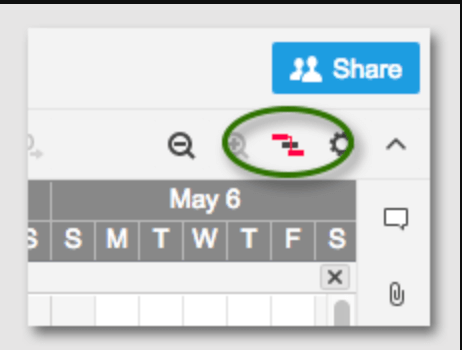
Select the Critical Path icon in the upper-right corner of the sheet.
Meet Your Goals Every Time with Critical Path Examples and Samples from Smartsheet
From simple task management and project planning to complex resource and portfolio management, Smartsheet helps you improve collaboration and increase work velocity -- empowering you to get more done.
The Smartsheet platform makes it easy to plan, capture, manage, and report on work from anywhere, helping your team be more effective and get more done. Report on key metrics and get real-time visibility into work as it happens with roll-up reports, dashboards, and automated workflows built to keep your team connected and informed.
When teams have clarity into the work getting done, there’s no telling how much more they can accomplish in the same amount of time. Try Smartsheet for free, today.