CPM and PERT
Project managers often combine the program evaluation and review technique (PERT) and the critical path method (CPM) when planning and scheduling projects. While PERT provides a framework for project scheduling, CPM pinpoints the task sequence that determines the project's duration.
The critical path method (CPM), or critical path analysis (CPA), is a project management technique that identifies the longest sequence of tasks in a project. The program evaluation and review technique (PERT) is a probabilistic project management tool used to factor uncertainty into project planning.
The combination of both methods, sometimes called PERT/CPM or PERT-CPM, facilitates a comprehensive evaluation of project timelines, resources, and risks, which in turn allows for more informed decision-making in project planning and execution.

“To me, combining PERT and CPM is like merging the best of both worlds,” says Michał Kierul, CEO of INTechHouse and Founder of SoftBlue S.A. “PERT is excellent for projects where the time estimates are uncertain; it provides a statistical approach to scheduling. On the other hand, CPM is ideal for projects where the time required for each activity is known.”

Tracy Kennedy, Chief Product Officer at tasmania.com, provides an example of a time when combining both methods made sense: “In one infrastructure upgrade project, the critical path method helped us with fixed tasks such as hardware installation, while PERT dealt with the variables such as software integration,” she explains. “The data showed both predictable and unpredictable elements, making the case for using both methods.”
Gantt Charts, PERT, CPM, and PERT/CPM: When to Use Each
Gantt charts are best suited for visualizing project schedules. PERT is ideal for projects with uncertain activity durations. CPM optimizes schedules using the critical path. When combined as PERT/CPM, the approach offers comprehensive planning and scheduling for complex projects.
“CPM is incredibly effective for projects with tasks that have predictable durations,” says Kennedy. “For example, when I managed the rollout of a new software system, CPM was indispensable. Each phase had a clear, quantifiable duration, so CPM helped us focus on tasks that could impact the project timeline.
“On the flip side, PERT is my choice for projects fraught with uncertainties,” she continues. “During a corporate merger in which predictability was low, I found PERT more appropriate. The method allowed us to consider various scenarios and uncertainties, offering a range of possible completion times.”
Here are some general differences between CPM, PERT, and Gantt charts:
| Critical Path Method (CPM) | Program Evaluation Review Technique (PERT) | Gantt Chart | |
|---|---|---|---|
| Application | Critical Path Method (CPM) Common in construction and manufacturing sectors | Program Evaluation Review Technique (PERT) Widely used in research and development projects | Gantt Chart Used across various industries and project sizes |
| Cost Implications | Critical Path Method (CPM) Emphasizes time-cost trade-offs | Program Evaluation Review Technique (PERT) Does not focus on costs | Gantt Chart Can be integrated with resource allocation but doesn't emphasize cost directly |
| Flexibility | Critical Path Method (CPM) Better for projects with well-defined tasks and durations | Program Evaluation Review Technique (PERT) Ideal for projects with inherent uncertainty and variability | Gantt Chart Suitable for sharing with stakeholders and tracking progress |
| Origin | Critical Path Method (CPM) Developed for industries with predictable task durations | Program Evaluation Review Technique (PERT) Developed by the U.S. Navy for projects with uncertain durations, such as the Polaris missile project | Gantt Chart Developed in the early 20th century for industrial scheduling |
| Presentation | Critical Path Method (CPM) Often activity-on-node, with arrows indicating precedence | Program Evaluation Review Technique (PERT) Activity-on-arrow chart | Gantt Chart Horizontal bars representing task durations against a timeline |
| Primary Focus | Critical Path Method (CPM) Determining the longest path in a project | Program Evaluation Review Technique (PERT) Planning and coordinating tasks with uncertain durations | Gantt Chart Visually representing task durations and sequences |
| Risk Assessment | Critical Path Method (CPM) Doesn't account for risk | Program Evaluation Review Technique (PERT) Emphasizes risk assessment | Gantt Chart Doesn't account for risk |
| Time Estimation | Critical Path Method (CPM) Uses deterministic time estimates | Program Evaluation Review Technique (PERT) Uses probabilistic time estimates (optimistic, most likely, pessimistic) | Gantt Chart Uses deterministic time estimates |
Gantt Charts, PERT, CPM, and PERT/CPM Decision Tree
Follow this simple decision tree to quickly determine which of these four methods is right for your project.

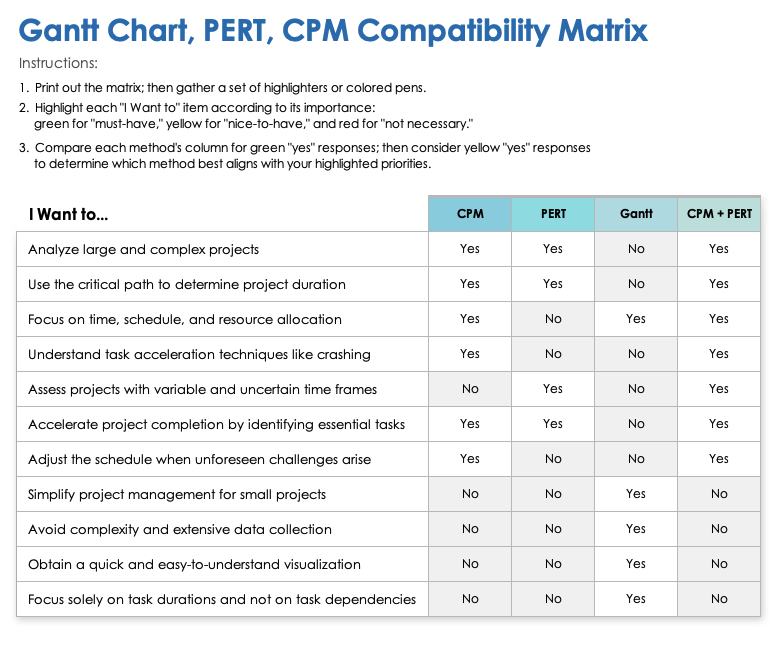
Gantt Charts, PERT, CPM, and PERT/CPM Compatibility Matrix
For additional guidance, see the following compatibility matrix, which offers a more detailed list of applications for each tool.
| I Want to... | CPM | PERT | Gantt | CPM + PERT |
| Accelerate project completion by identifying essential tasks | Yes | Yes | No | Yes |
| Adjust the schedule when unforeseen challenges arise | Yes | No | No | Yes |
| Analyze large and complex projects | Yes | Yes | No | Yes |
| Assess projects with variable and uncertain time frames | No | Yes | No | Yes |
| Avoid complexity and extensive data collection | No | No | Yes | No |
| Focus on time, schedule, and resource allocation | Yes | No | Yes | Yes |
| Focus solely on task durations and not on task dependencies | No | No | Yes | No |
| Obtain a quick and easy-to-understand visualization | No | No | Yes | No |
| Simplify project management for small projects | No | No | Yes | No |
| Understand task acceleration techniques such as crashing | Yes | No | No | Yes |
| Use the critical path to determine project duration | Yes | Yes | No | Yes |
If you prefer to work on physical paper, try printing out the matrix and highlighting the features that are important to your project. By doing so, you can get a clearer image of which method will work best for you.
Download the Printable Gantt Chart, PERT, CPM Compatibility Matrix for
Microsoft Word | Excel | Adobe PDF | Google Doc | Google Sheet
Benefits of Using PERT and CPM
CPM and PERT are powerful project management tools that optimize scheduling. While CPM is ideal for projects with well-defined task durations, PERT excels in managing projects with uncertain timelines, accounting for variability.
PERT enables effective management of project uncertainty, allowing teams to visualize complex task sequences and make data-driven decisions based on probabilistic time estimates.
Here are some specific benefits of using PERT:
- Clarity in Project Milestones and Objectives: PERT charts help in clearly defining and visualizing project milestones, ensuring that team members and stakeholders are always aligned.
- Enhanced Decision-Making: PERT provides a clear visualization of the project's tasks and their interdependencies, aiding in strategic decision-making.
- Improved Risk Management: By emphasizing probabilistic estimates of task duration, PERT enables a project team to better understand and manage risks.
- Increased Stakeholder Confidence: The detailed analysis involved in PERT can build confidence among stakeholders by showcasing rigorous planning.
- Optimized Time Management: PERT helps in identifying critical and non-critical activities, enabling better focus and allocation of resources.
CPM clearly identifies the critical path of a project, facilitating focused execution and enabling strategic allocation of resources to expedite project completion.
Here are the key advantages of using CPM:
- Enhanced Predictability and Planning: CPM allows for clear planning and sets expectations, which can lead to better predictability of project outcomes.
- Focused Project Execution: CPM identifies the critical path, helping teams to prioritize those tasks, leading to more focused and efficient work.
- Higher Stakeholder Trust: Transparency in the project's critical path and timelines can lead to increased trust from stakeholders.
- Improved Resource Allocation: Knowing the critical path allows for more effective allocation of resources.
- Reduced Project Duration: By identifying the critical path and allowing for task crashing, CPM can help in reducing the project duration.
Teams that choose to combine both PERT and CPM will enjoy all of these benefits, in addition to the following:
- Comprehensive Project Understanding: Combining PERT and CPM can provide a more complete picture of a project, including both task dependencies and duration variability.
- Enhanced Adaptability: The combination can make it easier to adjust plans in response to changes or unforeseen challenges.
- Improved Morale: The combination allows for clearer responsibilities and better planning, which can boost team confidence and morale.
- Reduced Uncertainty: The PERT/CPM combination can help in reconciling the deterministic nature of CPM with the probabilistic estimates of PERT, leading to reduced uncertainty in project timelines.
“I often combine the two when I'm dealing with complex IT projects that have both known and unknown variables,” explains Kierul. “The benefit is a more flexible project schedule that accounts for uncertainties while optimizing time.”
How to Use PERT in the Critical Path Method
Project managers use PERT to calculate probabilistic time estimates (optimistic, most likely, and pessimistic) for project tasks. They can then take this information to plot tasks on the critical path while also accounting for uncertainty.
When using CPM, project managers can employ PERT to estimate the duration of tasks more realistically. Instead of relying on a single time estimate for each task, PERT uses three time estimates: optimistic (shortest possible time), most likely (most probable duration), and pessimistic (longest possible time). Managers can use these three estimates to calculate an expected time for each task and, thus, be able to determine the project’s critical path.
Tasks on the critical path, called critical tasks or critical activities, cannot be delayed without delaying the completion date of the entire project.
In summary, PERT's sophisticated time estimates add a layer of risk assessment to CPM, allowing for more informed planning and decision-making in managing projects.
How to Find the Critical Path on a PERT Chart
To find the critical path on a PERT chart, calculate the earliest and latest start and finish times for each task. Next, identify the longest task sequence in the project, where the earliest and latest start times are the same.
Follow these steps to chart your critical path on a PERT chart:
List Tasks and Dependencies: Identify all the tasks necessary to complete the project and the dependencies between these tasks.
Task Dependencies 1 None 2 None 3 Is dependent on the completion of tasks 1 and 2 4 None Estimate Task Durations: Use PERT to estimate the duration of each task. For each task, PERT requires three time estimates: optimistic time (O), most likely time (M), and pessimistic time (P).
Task Optimistic Time Most Likely Time Pessimistic Time 1 1 3 5 2 1 2 3 3 7 9 11 4 7 10 13 - Calculate the Expected Time for Each Task: Plug the time estimates for each task into the following formula to determine the expected time (ET) for each task.
ET = ( O + 4M + P ) / 6
| Task | Expected Time |
| 1 | 3 |
| 2 | 2 |
| 3 | 9 |
| 4 | 10 |
Another option is to use triangular distribution, which is a straightforward average of the three estimates. This method doesn't favor the most likely scenario as heavily. In this instance, use the following formula:
ET = ( O + M + P ) / 3
- Create a Network Diagram: Draw a network diagram that visually represents the tasks and their dependencies.
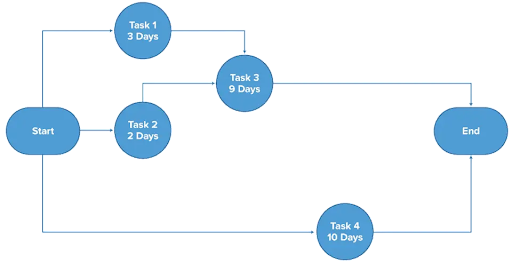
- Find the Critical Path: Using the time estimates, PERT helps to determine the critical path. Any delay in the tasks on this path will directly impact the project's finish date.
Path 1 = Task 1 + Task 3 = 3 + 9 = 12 days
Path 2 = Task 2 + Task 3 = 2 + 9 = 11 days
Path 3 = Task 4 = 10 = 10 days
In this case, the first path, consisting of tasks 1 and 3, is the critical path because it has the longest total duration (12 days).
How to Calculate the Critical Path in PERT
To calculate the critical path in PERT, first determine the earliest and latest start and finish times for each activity. The critical path consists of activities where the difference between their earliest and latest start or finish times is zero.

Andrei Vasilescu, Co-Founder and CEO of DontPayFull, breaks the process down into five simple steps: “One, identify all tasks in your project along with their dependencies. Two, create a network diagram representing these tasks. Three, calculate start and early finish dates for each task. Four, determine late finish dates for each task. Five, find the critical path by identifying the path in the network diagram where the early start/finish dates match the late start/finish dates for each task along that path.”
Here is a closer look at each of the steps for calculating the critical path in PERT:
List All Tasks: Similar to finding the critical path on a PERT chart, the first step in calculating the critical path in PERT is to list all the activities involved in the project. Next, identify their dependencies. Finally, calculate their expected time by using the PERT formula of ET = ( O + 4M + P ) / 6.
Task Number Dependencies Optimistic Time in Days (O) Most Likely Time in Days (M) Pessimistic Time in Days (P) Expected Time in Days (ET) 1 None 5 6 7 6 2 1 2 4 6 4 3 2 1 5 9 5 4 3 2 5 14 6 5 3,6 10 12 14 12 6 2 1 4 13 5 - Determine Earliest Start and Finish Times: For each task, calculate the earliest start time (ES) and the earliest finish time (EF). This is done by starting with the first task and moving forward through the project, using the following formulas:
ES for the first task = 0
EF = ET + ES
ES for a subsequent task = the highest EF of all its immediate predecessors
| Task | Dependencies | Expected Time in Days (ET) | Earliest Start in Days (ES) | Earliest Finish in Days (EF) |
| 1 | None | 6 | 0 | 6 |
| 2 | 1 | 4 | 6 | 10 |
| 3 | 2 | 5 | 10 | 15 |
| 4 | 3 | 6 | 15 | 21 |
| 5 | 3,6 | 12 | 15 | 27 |
| 6 | 2 | 5 | 10 | 15 |
- Determine Latest Start and Finish Times: For each task, calculate the latest start time (LS) and the latest finish time (LF). This is done by moving backward through the project, starting from the end, and using the following formulas:
LF for the last task = EF
LS = LF - ET
LF for a preceding task = the minimum LS of all its immediate successors
| Task | Dependencies | Expected Time in Days (ET) | Earliest Start in Days (ES) | Earliest Finish in Days (EF) | Latest Start in Days (LS) | Latest Finish in Days (LF) |
| 1 | None | 6 | 0 | 6 | 0 | 6 |
| 2 | 1 | 4 | 6 | 10 | 4 | 10 |
| 3 | 2 | 5 | 10 | 15 | 10 | 15 |
| 4 | 3 | 6 | 15 | 21 | 21 | 27 |
| 5 | 3,6 | 12 | 15 | 27 | 15 | 27 |
| 6 | 2 | 5 | 10 | 15 | 22 | 27 |
Remember that in this example, Task 5 is dependent on Task 6, which means it is the last task in the sequence. For Task 5, EF = 27, which means LF = 27.
- Calculate Slack for Each Activity: Slack, or float, is the amount of time an activity can be delayed without affecting the project's completion time. Use either of the following formulas to calculate slack (S) for each activity:
S = LS - ES
S = LF - EF
Task | Dependencies | Expected Time in Days (ET) | Earliest Start in Days (ES) | Earliest Finish in Days (EF) | Latest Start in Days (LS) | Latest Finish in Days (LF) | Slack in Days (S) |
| 1 | None | 6 | 0 | 6 | 0 | 6 | 0 |
| 2 | 1 | 4 | 6 | 10 | 6 | 10 | 0 |
| 3 | 2 | 5 | 10 | 15 | 10 | 15 | 0 |
| 4 | 3 | 6 | 15 | 21 | 21 | 27 | 6 |
| 5 | 3,6 | 12 | 15 | 27 | 15 | 27 | 0 |
| 6 | 2 | 5 | 10 | 15 | 22 | 27 | 6 |
- Identify the Critical Path: Activities with zero slack are on the critical path. Therefore, the critical path is the second identified path: Task 1, Task 2, Task 3, and Task 5.
By following these steps and using the given formulas, you'll be able to identify the critical path in a PERT chart and gain a clearer understanding of which activities are most critical to the timely completion of the project.
How to Create a PERT Diagram for a Project Using CPM
To create a PERT diagram, start by drawing nodes for each task, labeling them with estimated times, and connecting them with arrows based on task dependencies. When you’re done, highlight this path, which represents the longest duration through the project.
Here is a step-by-step guide to creating a PERT diagram using CPM, with examples from the same data set used in the previous section:
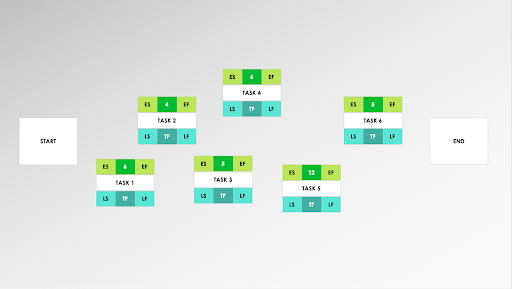
- Draw Initial Nodes: Draw a circle or a rectangle on the left side of your paper or digital workspace to represent the starting point of your project. This is usually called the start node. Then draw a circle or a rectangle on the far-right side to represent the finish node or end node.

- Add Tasks to the Diagram: For each task in your list, draw a circle or a rectangle and label it with the task name or identifier and the estimated time for completion.
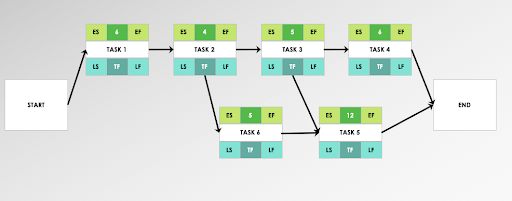
- Connect Tasks Based on Dependencies: Using arrows, connect the tasks based on their dependencies. The direction of each arrow indicates the sequence of tasks. For example, as Task 2 is dependent on Task 1, draw an arrow from Task 1 to Task 2. Ensure that all tasks are connected from the start node to the end node, either directly or indirectly through other tasks.
- Label the Diagram: Once you calculate the estimated time (ET), earliest start (ES), earliest finish (EF), latest start (LS), latest finish (LF), and slack time (S) for each task in your project, add that information to your diagram. This information is often placed near or inside the task’s circle or rectangle.
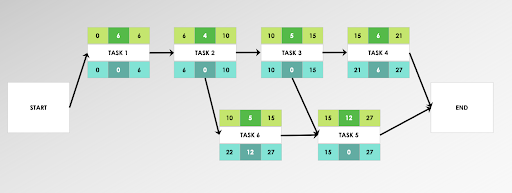
- Highlight the Critical Path on Your Diagram: The critical path is the sequence of tasks that has zero slack or float. Tasks with zero slack are on the critical path. Highlight these tasks and arrows, connecting them to clearly show the critical path on your diagram.
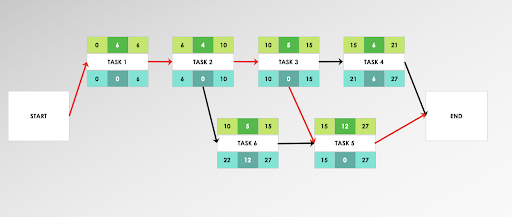
- Review and Adjust the Diagram: Ensure that all dependencies are correctly represented and that the critical path is clearly marked. Adjust the layout of the tasks and arrows as necessary for clarity and readability.
- Finalize and Share the Diagram: Review the diagram for accuracy and completeness. Save or print the diagram and share it with stakeholders as required.
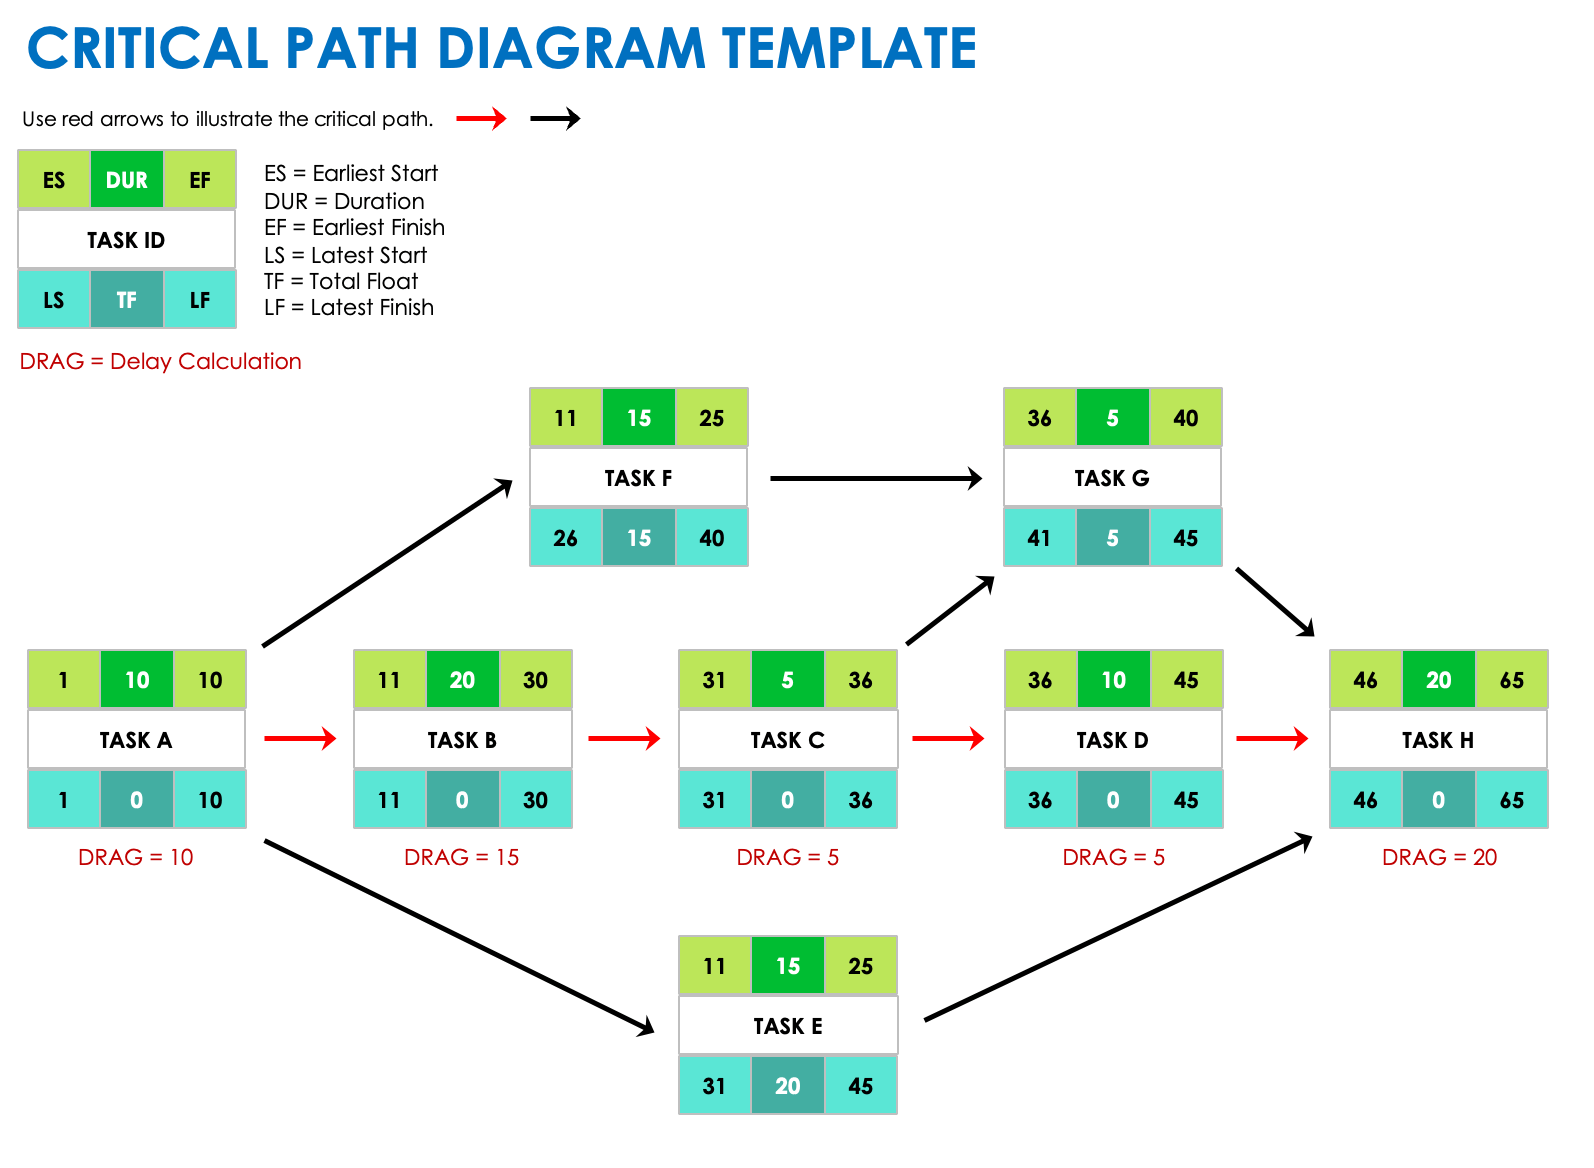
Critical Path Diagram Template
Download a Critical Path Diagram Template for
Excel
|
PowerPoint
If you want a helpful option to assist you in drawing your critical path diagram, consider using this critical path analysis template. It features a network diagram that includes nodes, each with the task name, earliest start and finish dates, latest start and finish dates, duration, and total float time. Additionally, the template allows you to display critical path drag, which represents the amount of time that a critical path task adds to the overall project duration.
Simple Example of Finding the Critical Path Using PERT
It can be helpful to illustrate PERT/
Schedule Moving Truck or Servicel apartment to another by using PERT/CPM methodology.
First, list your tasks and dependencies:
| Task Number | Task | Dependencies |
| 1 | Select and Rent New Apartment | None |
| 2 | Notify Current Landlord | 1 |
| 3 | Sort and Declutter Current Belongings | None |
| 4 | Purchase Moving Supplies | 3 |
| 5 | Pack Items | 4 |
| 6 | Schedule Moving Truck or Service | 5 |
| 7 | Notify Utility Companies | 1 |
| 8 | Move Into New Apartment | 2 |
Next, list the pessimistic, most likely, and optimistic time estimates for each task. Use these estimates to calculate expected time:
| Task Number | Task | Optimistic Time (O) | Most Likely Time (M) | Pessimistic Time (P) | Expected Time (ET) |
| 1 | Select and Rent New Apartment | 15 days | 20 days | 25 days | 20 days |
| 2 | Notify Current Landlord | 1 day | 2 days | 3 days | 2 days |
| 3 | Sort and Declutter Current Belongings | 6 days | 8 days | 10 days | 8 days |
| 4 | Purchase Moving Supplies | 1 day | 3 days | 5 days | 3 days |
| 5 | Pack Items | 3 days | 4 days | 5 days | 4 days |
| 6 | Schedule Moving Truck or Service | 3 days | 5 days | 7 days | 5 days |
| 7 | Notify Utility Companies | 1 day | 2 days | 3 days | 2 days |
| 8 | Move Into New Apartment | 1 day | 2 days | 3 days | 2 days |
Once you’ve calculated expected times for each task and plotted them on your network diagram, you can calculate the earliest and latest start and finish times, as well as slack time, for each task.
| Task Number | Task | Expected Time in Days (ET) | Earliest Start in Days (ES) | Earliest Finish in Days (EF) | Latest Start in Days (LS) | Latest Finish in Days (LF) | Slack in Days (S) |
| 1 | Select and Rent New Apartment | 20 | 0 | 20 | 0 | 20 | 0 |
| 2 | Notify Current Landlord | 2 | 20 | 22 | 20 | 22 | 0 |
| 3 | Sort and Declutter Current Belongings | 8 | 0 | 8 | 16 | 24 | 16 |
| 4 | Purchase Moving Supplies | 3 | 8 | 11 | 12 | 15 | 4 |
| 5 | Pack Items | 4 | 11 | 15 | 15 | 19 | 4 |
| 6 | Schedule Moving Truck or Service | 5 | 15 | 20 | `19 | 24 | 4 |
| 7 | Notify Utility Companies | 2 | 20 | 22 | 22 | 24 | 2 |
| 8 | Move Into New Apartment | 2 | 22 | 24 | 22 | 24 | 0 |
In this example, the critical path consists of Task 1, Task 2, and Task 8 because the slack time for these tasks is zero. Therefore, in order not to delay your move, the longest sequence of tasks that you need to complete on time are to select and rent the new apartment, notify your landlord, and move into the new apartment.

For more helpful information, see this article on critical path examples.
History of PERT With CPM
PERT and CPM both emerged during the mid-20th century as innovative solutions to complex project planning challenges. While they were both developed independently, the two methods eventually converged due to their common goal of improving project efficiency.
In 1957, during the Cold War, PERT was developed by the U.S. Navy, specifically for the Polaris missile project. The Navy aimed to reduce the time required for completion of the missile development without compromising on quality or increasing costs. Around the same time, the chemical company E.I. duPont de Nemours developed CPM to address scheduling challenges in projects such as plant maintenance and construction. Unlike PERT, which dealt with uncertain time frames, CPM was rooted in deterministic time estimates.
Both techniques became popular in industries where project management was crucial. By the 1960s, they were being widely used in construction, research and development projects, and more. The introduction of mainframe computers during this era also played a role in the growth of these methods.
As professionals started recognizing the strengths and weaknesses of each method over time, they began to integrate features from one into the other. Today, it's common to see hybrid methodologies in use, often referred to as PERT/CPM.
With the proliferation of project management software in the late 20th and early 21st centuries, tools such as Microsoft Project incorporated principles of both PERT and CPM, further cementing their legacy.
Optimize Your Project Scheduling with PERT, the Critical Path Method, and Smartsheet
From simple task management and project planning to complex resource and portfolio management, Smartsheet helps you improve collaboration and increase work velocity -- empowering you to get more done.
The Smartsheet platform makes it easy to plan, capture, manage, and report on work from anywhere, helping your team be more effective and get more done. Report on key metrics and get real-time visibility into work as it happens with roll-up reports, dashboards, and automated workflows built to keep your team connected and informed.
When teams have clarity into the work getting done, there’s no telling how much more they can accomplish in the same amount of time. Try Smartsheet for free, today.