What Is a Project Portfolio Dashboard?
A project portfolio dashboard is a visual tool that teams use to monitor, track, and manage multiple projects at once. Teams use these dashboards to get an overall picture of the health of each project within a larger, related portfolio.
The goal of a project portfolio dashboard is to summarize the most important information about multiple projects in one, central location. This eliminates the need to check on each project individually. Using a project portfolio dashboard, you can see all key project health indicators — such as milestones, budget, and resource availability — with the help of charts and metrics that make the data easy to understand.
Dashboards are essential in modern business because projects are often interrelated in terms of goals, timeline, and budget. Today, executive leadership, portfolio managers, IT directors, and project managers all rely on dashboards for centralized, high-level reporting.
Learn more in our complete guide to the basics of project portfolio management (PPM).
Main Elements in Project Portfolio Dashboards
There is no one-size-fits-all approach to creating a project portfolio dashboard. Each dashboard will be unique to the project, organization, and industry. Still, there are several common elements, such as a timeline, status indicators, and visual charts and metrics, that provide a clear snapshot of project progress.
Here is a list of the most common components in a project portfolio dashboard:
- Project Portfolio Overview: The dashboard should include basic information about each project in the portfolio, such as project name, goal, objective, and team members. Including this information reduces the possibility of getting lost in an overwhelming amount of data about multiple projects.
- Timelines: Incorporate a high-level schedule for each project that includes the main work units, major tasks or features to be developed, and expected date of delivery for each. This timeline should also show how the projects interact with each other (e.g., if the delivery of one project depends on on-time delivery of another).
- Status Markers: Include an overall status marker for each project, as well as for the overall portfolio. This could be a numerical value, a color-coding system, or a simple key to indicate whether a project is on time, delayed, or early.
- Charts and Graphical Reports: The exact graphical elements you choose will depend on the types of projects in your portfolio. Consider a Gantt chart, a classic timeline, a line chart, a work breakdown structure (WBS), or a velocity chart. These visual elements are a key part of a dashboard’s utility because they make metrics, data, and trends instantly understandable to the viewer.
- Budget Information: Highlight important financial data, and be sure to indicate if the project is under or over budget. Depending on the project, you might also include more sophisticated financial models to show more granular or complex views of the anticipated budget.
- Resource Management: Your dashboard should also show current resource allocation and utilization information. Displaying this information will help leadership determine if they need to reassign resources or find extra team members or budget to stay on track. As part of this section, you might include a tracker for planned vs. actual hours. This is helpful to track overall resource spend, as well as to forecast the budget for future projects.
- Task Trackers: Without getting too granular, highlight the most important tasks and their status. You might consider adding a simple tracker that shows the number of completed vs. remaining tasks or a widget that displays overdue tasks.
- Risk Overview: Make note of any current risks to your portfolio. This could be in the form of a simple list of risks (including their likelihood and potential impact), a risk matrix, or a risk mitigation plan that details how you will prevent or lessen the impact of each risk.
Additionally, your project portfolio dashboard should include links to individual project plans. This way, viewers can easily navigate to more detailed documents about the health of each project.
Explore our roundup of tracking templates and dashboards for multiple projects, or download one of our simple PPM templates to get started.
Types of Project Portfolio Dashboards
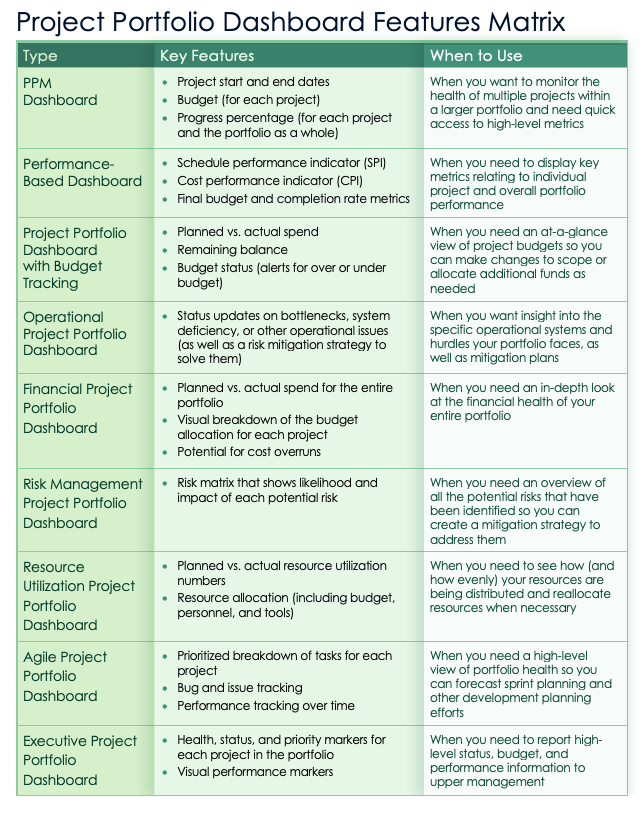
You can create a dashboard for any type of project portfolio, including PPM, budget-focused, operational, financial, risk management-based, Agile, or one intended for executive leadership. The type you create will depend on your specific project, intended audience, and company goals.
This printable matrix lists key features of each type of dashboard, as well as when to use each:

Download a Project Portfolio Dashboard Features Matrix for
Microsoft Word
| Google Docs |
Adobe PDF
Project Portfolio Management Dashboard
A project portfolio management dashboard is a standard dashboard that tracks the health of multiple projects within a larger portfolio. A typical PPM dashboard includes space to track the health, priority, progress, and risks associated with each project.

Jillian Knoepfel is the Content Operations Manager at Smartsheet. She has a background in content and creative operations and program management, specializing in overseeing multiple projects while improving operational efficiency and ensuring the right data reaches the right decision-makers. She also has extensive experience working with dashboards.
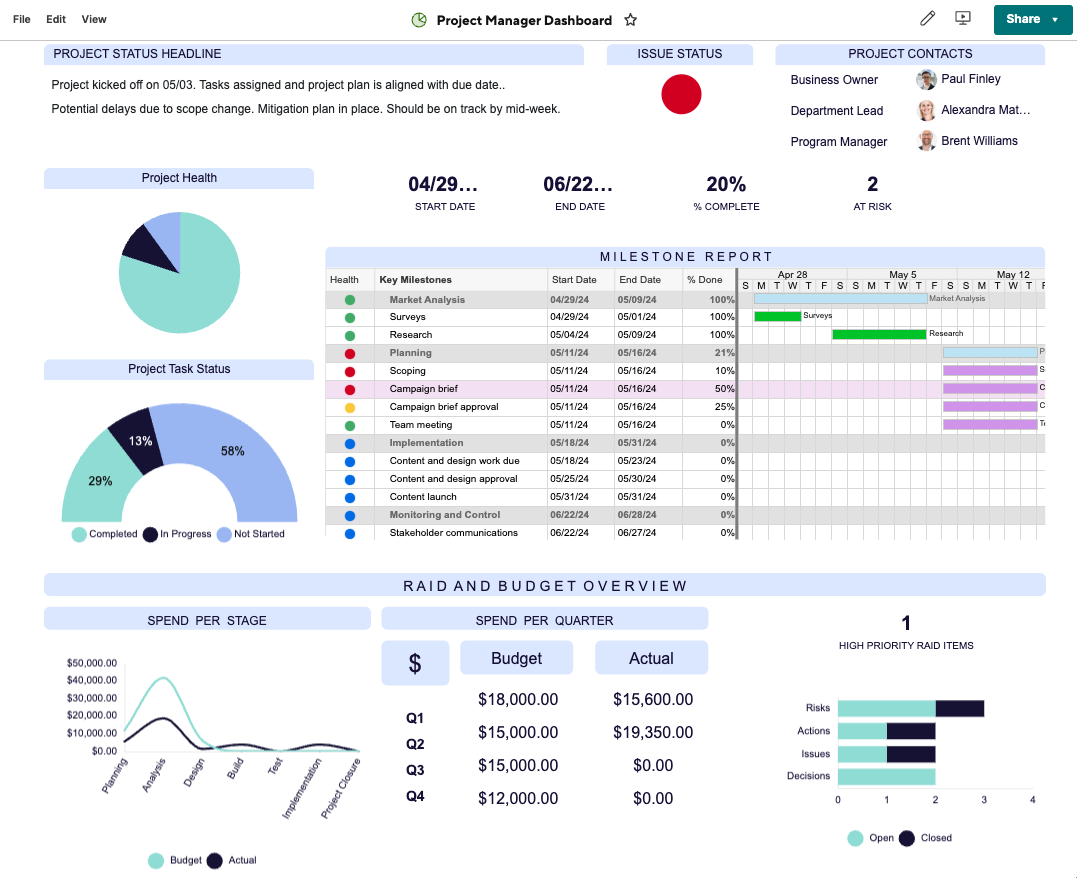
She shares the following example of a dashboard that she used for project portfolio management. It includes space to list project status, contacts, graphics that display overall project health and task status, start and end dates, percentage complete, and a detailed milestone report. Additionally, it includes a section for resource and budget spend.

To get started, download this project portfolio dashboard template for Excel. You can also find a variety of simple project portfolio templates in Smartsheet in our template gallery.
Performance-Based Project Portfolio Dashboard
A performance-based project portfolio dashboard highlights key metrics related to the outcome, or performance, of the projects within a portfolio. These metrics may include a schedule performance index (SPI), a cost performance index (CPI), other project completion rates such as task and budget, and a risk analysis.

Vivian Au is the founder of Air Corporate, an organization that helps entrepreneurs in Hong Kong register their businesses. She has more than eight years of experience working with project portfolio dashboards and using them to help manage remote teams.
“I once managed a global software development portfolio where a performance-based dashboard was indispensable. We were tracking KPIs such as team velocity, sprint completion rates, and budget burn,” she shares. “The dashboard allowed us to quickly pinpoint which projects were falling behind and allocate resources accordingly. Without it, we would have faced delays and missed critical deadlines. The real power of the dashboard was in the visualization; it made complex data digestible and actionable at a glance.”
Check out our performance-based dashboard template to get started, and refer to the image below with sample data to see an example.
Project Portfolio Dashboard With Budget Tracking
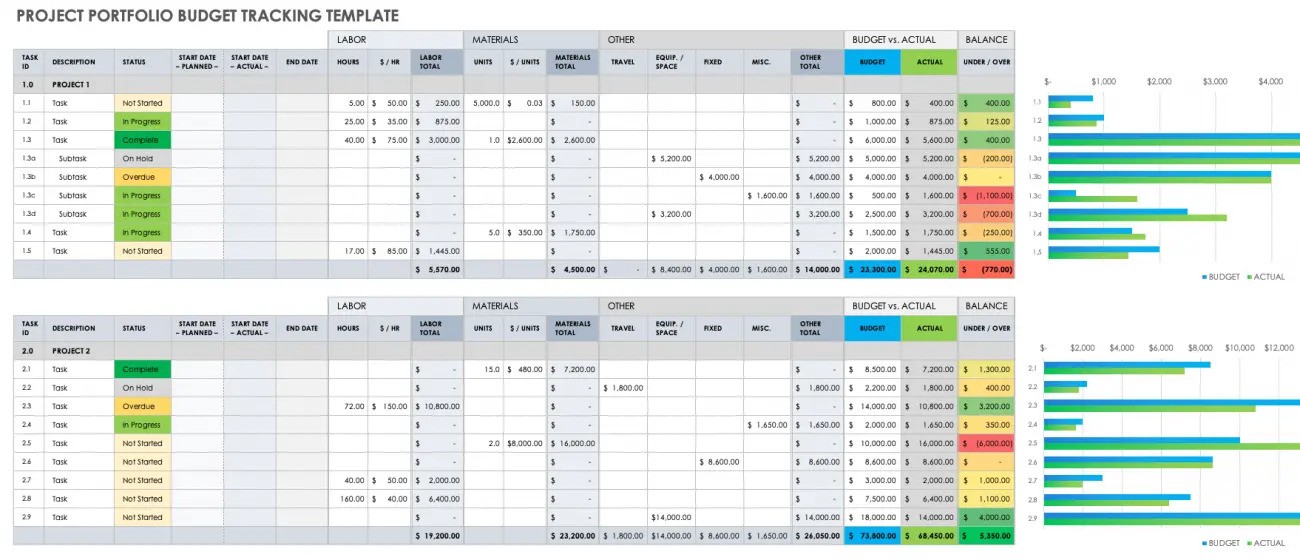
Some project portfolio dashboards include a specific budget-tracking element and are ideal for tracking finances related to both individual projects and the overall portfolio. Budget tracking dashboards typically include a cost breakdown, planned vs. actual spend, risk and mitigation strategies related to budget, and outstanding balance.
The goal of a PPM dashboard with budget tracking is to give stakeholders an overall view of project and portfolio finances, as well as alert them if the project is over budget so they can pivot as needed.
Below, you’ll find an example of a project portfolio dashboard with budget tracking, including sample data. Depending on your needs, you can choose to include less granular budget-related data on your dashboard, displaying only the most important metrics. The graphs to the right of the spreadsheet provide an at-a-glance view of budget health over time.

To get started, download the project portfolio dashboard budget tracking template for Microsoft Excel.
Operational Project Portfolio Dashboard
An operational project portfolio dashboard focuses on the systems and operations that go into the execution of each project and the overall portfolio. In addition to the elements of a standard PPM dashboard, an operational dashboard includes information on bottlenecks, resource constraints, risk analysis, and other operational delays that need to be addressed.
Here is an example of an operational project portfolio dashboard with sample data. Download the operational project portfolio dashboard in our template roundup page to get started.
Financial Project Portfolio Dashboard
A financial project portfolio dashboard is ideal for tracking spending for the overall portfolio. It is different from the budget-tracking dashboard above in that it is solely concerned with project and portfolio financials, offering deeper insights into cost trends, budget variances, and at-risk projects.
A typical financial PPM dashboard includes sections for planned vs. actual spend, a visual breakdown of budget for both projects and initiatives within those projects, and at-risk projects that may overrun costs. You can use this type of dashboard to make changes to project scope or allocate more budget to specific initiatives.
Check out our free financial project portfolio dashboard to build your own using Microsoft Excel. It comes pre-filled with sample data, as illustrated in the image below, for your reference.
Risk Management Project Portfolio Dashboard
Teams can create a risk management project portfolio dashboard to track and monitor all risks related to each project in their portfolio, including delays, cost overruns, resource shortages, faulty deliverables, and more.
Au of Air Corporate shares her experience using a risk management dashboard in her career: “During a high-stakes merger, a risk-focused dashboard helped us track potential compliance and integration risks in real time, preventing costly delays,” she says. “These specialized dashboards can be lifesavers when managing particularly volatile projects.”
Check out our risk management dashboard for PowerPoint, which includes a risk matrix that shows the likelihood and severity of each risk.
Resource Utilization Project Portfolio Dashboard
A resource utilization project portfolio dashboard displays the current allocation of resources — including budget, tools, and personnel — across your portfolio. You can use this information to identify areas of need and either reallocate or request more resources to ensure your projects remain on time and within budget.
Depending on the level of detail that your resource utilization dashboard includes, you can also use it to ensure that workloads are balanced among team members and reassign roles or redistribute work as needed.
Create your own resource utilization project portfolio dashboard in Excel using our free template. Below, you’ll find an example of such a dashboard, which visually shows planned vs. actual resource utilization in a graph.
Agile Project Portfolio Dashboard
Teams that employ the Agile project management methodology will benefit from an Agile project portfolio dashboard. This dashboard aids in sprint planning by displaying all related projects side by side, tracking bugs, and providing a breakdown of all tasks by priority.
Agile project portfolio dashboards work well for teams managing projects that require a high degree of flexibility due to changing conditions or unexpected setbacks, such as complex technical issues in software development.
You can create your own Agile project portfolio dashboard in Excel using our free downloadable template. Check out the sample, pre-filled dashboard below for inspiration.
Executive Portfolio Dashboard
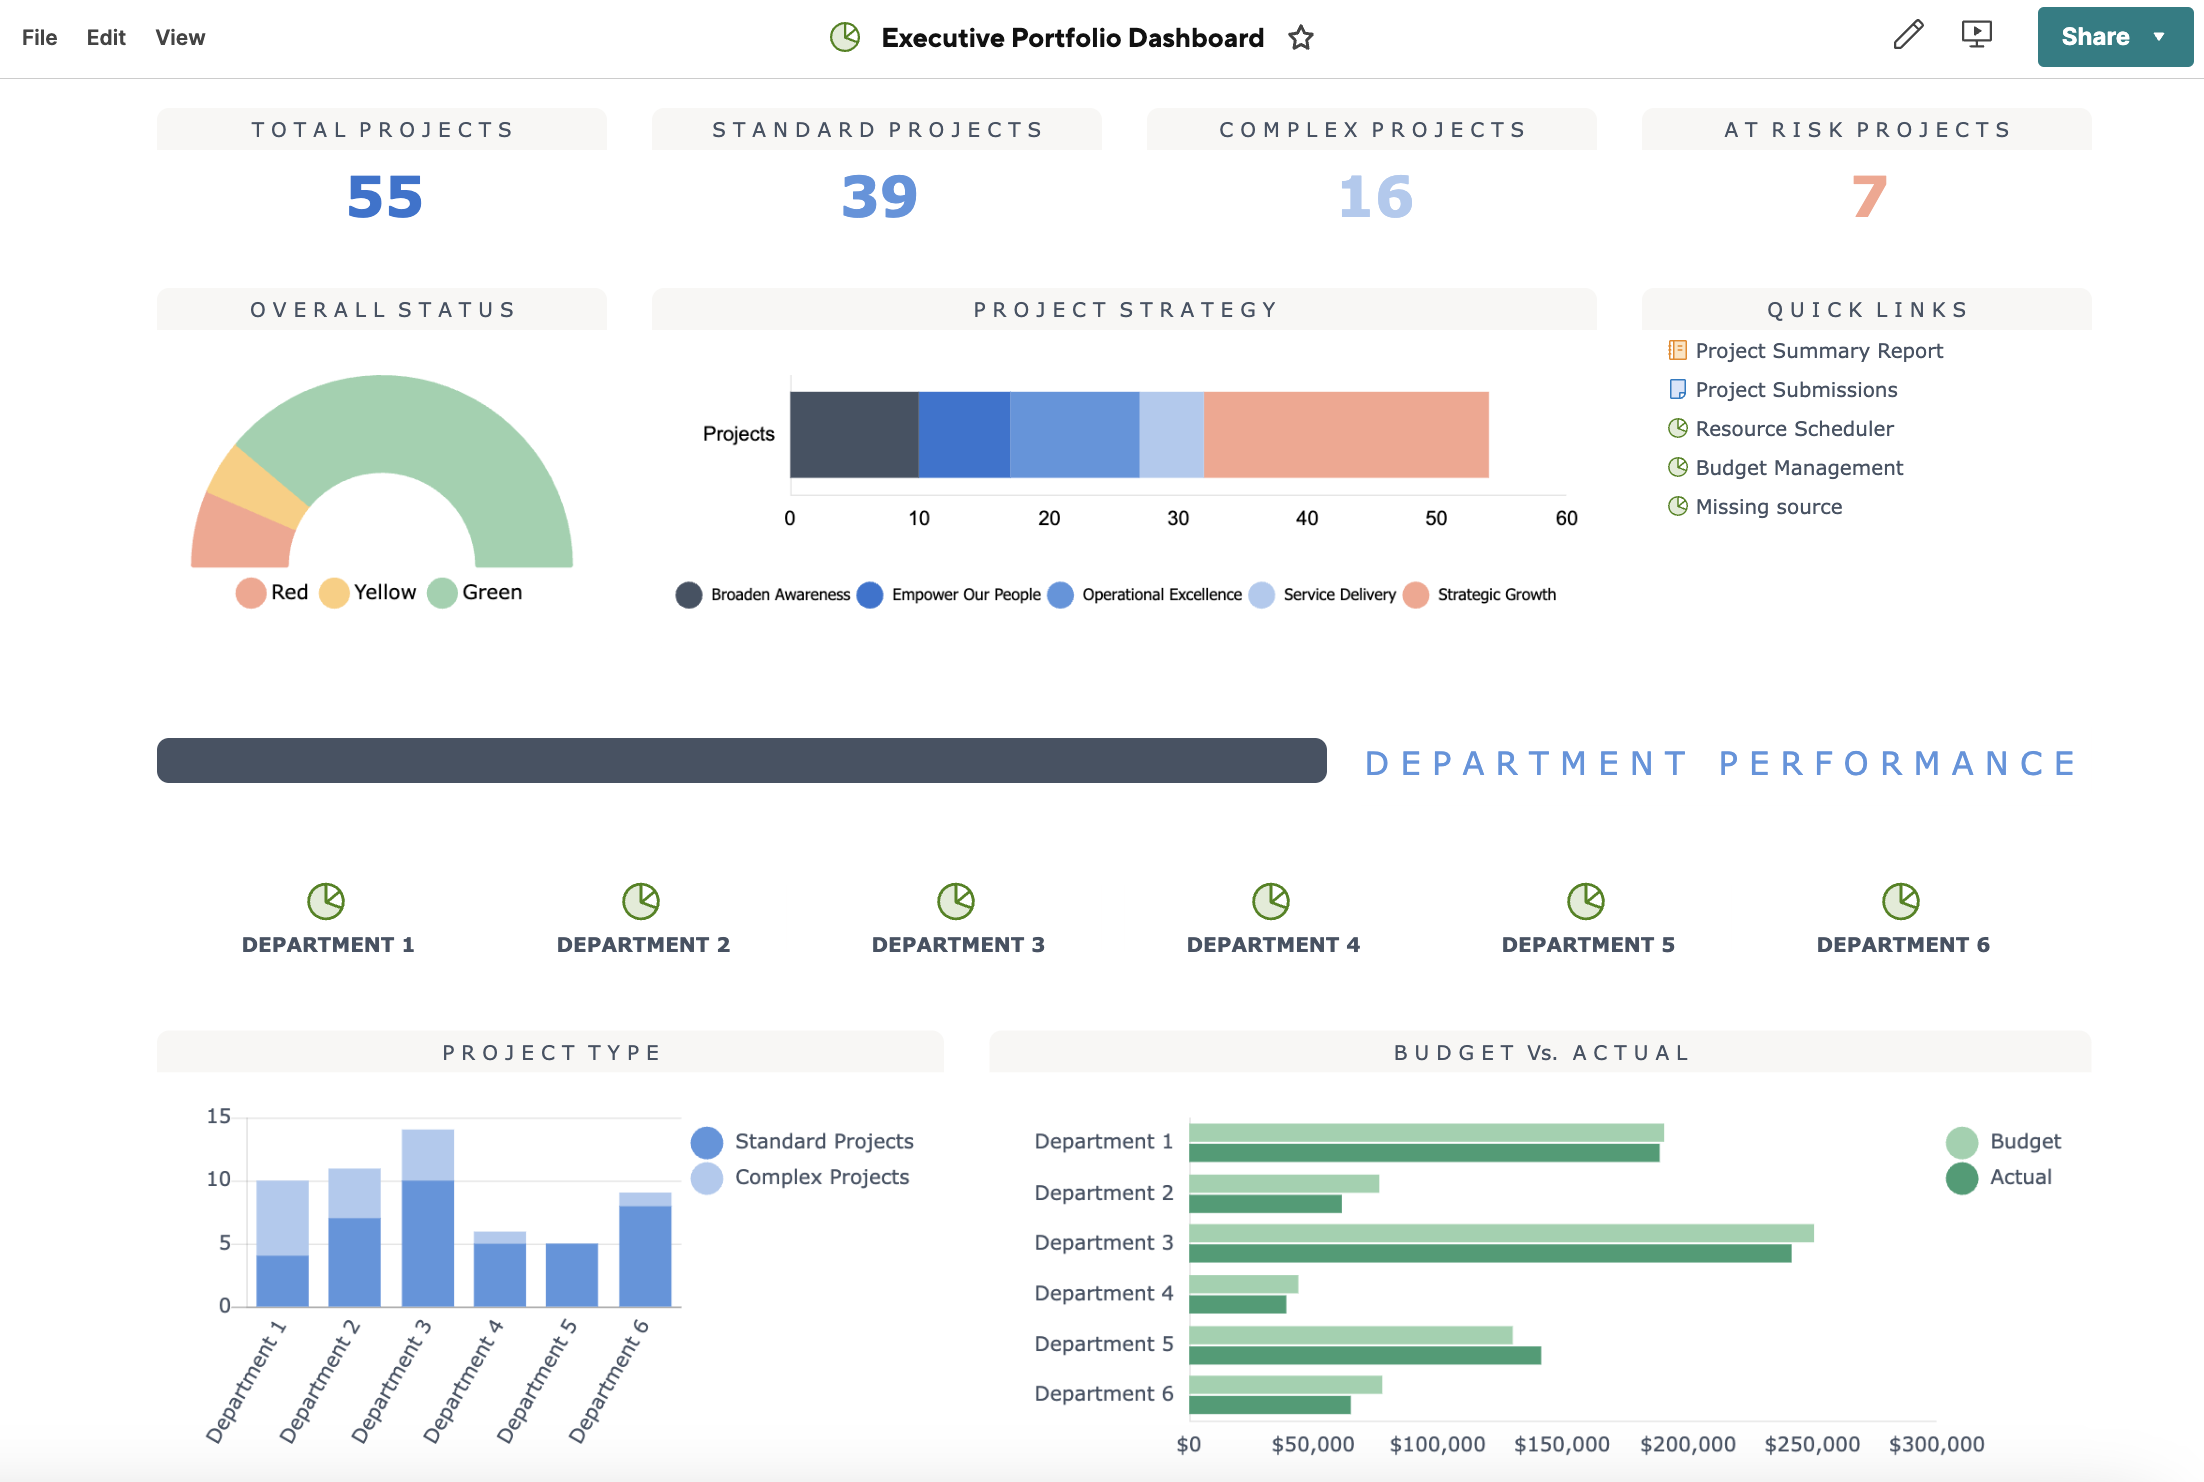
An executive portfolio dashboard is ideal for presentations to management, executives, or the C-suite. It summarizes the most critical information about portfolio health without overwhelming the audience with details. It should relay high-level progress, budget, and performance information.
Knoepfel of Smartsheet shares the following example of an executive portfolio dashboard she’s used in her career. It highlights the number of active projects, overall status, performance data for each department, and budget tracking information. It also includes a list of quick links so stakeholders can easily explore each project’s status in greater depth.

You can use our project portfolio management summary template, available in Excel and Google Sheets formats, to create your own executive dashboard.
Best Practices for Project Portfolio Dashboards
Strong project portfolio dashboards are clear and audience-specific with easy-to-understand visuals. When simple and focused, these dashboards help stakeholders — from executives to project managers — quickly access key metrics without extra details, ensuring they can make informed decisions with up-to-date information.
The following are some expert tips on how to get the most out of project portfolio dashboards:
- Know Your Audience: Tailor the dashboard view for different stakeholders, such as executives, project managers, and team leads. Focus on high-level KPIs for executives and more granular details for project managers. Knoepfel of Smartsheet recommends creating multiple dashboards. “Consider creating separate dashboards for different stakeholders to ensure they have only the information that matters most to them without needing to dig,” she says. “Different stakeholders have different needs and responsibilities, so understanding what’s important to your audience and enables them to make key decisions quickly is vital.”
- Define Clear Objectives and Metrics: Once you’ve identified your audience, ensure that the dashboard serves a clear purpose and meets their needs. Identify the KPIs that matter most to relevant stakeholders (such as budget, timeline, resource allocation, or ROI) and that align with business goals or project success. “Without clear objectives, the dashboard may become cluttered with irrelevant data, reducing its effectiveness for interpretation or decision-making,” says Knoepfel.
- Keep It Visual: The goal of the dashboard is to make data easier to find and understand. “Use charts, graphs, metrics, and visual indicators such as red-yellow-green traffic lights to represent complex data in a digestible format,” says Knoepfel. “Stakeholders need to quickly grasp the status of the portfolio at a glance, so avoid overloading the dashboard with text.”
- Highlight Risks and Dependencies: Identifying risks and dependencies is a key aspect of strong portfolio management. “Make risks, issues, and dependencies a central part of the dashboard by color coding and highlighting areas requiring immediate attention,” recommends Knoepfel. “Early visibility helps to mitigate issues before they escalate.” Additionally, once you’ve identified all possible risks, note their likelihood and impact and start building risk mitigation strategies.
- Ensure Real-Time Updates: Look for a cloud-based tool that allows you to build dashboards that update in real time so you can ensure automatic data collection and reporting. According to Knoepfel, this reduces manual entry errors and delays, while also increasing your likelihood of success. “Decision-making relies on having the latest information, so a dashboard that’s out of date is less useful, especially in fast-moving projects,” she says.
Benefits of Project Portfolio Dashboards
Project portfolio dashboards improve visibility, communication, decision-making, and transparency for projects in a portfolio. When set up well, dashboards boost efficiency by showing key information in clear visuals. They also point out areas that need attention to teams and stakeholders.
To get the most out of your dashboard, invest in a solution that allows you to easily build a real-time information hub that pulls data from live, underlying sources.
As Knoepfel of Smartsheet says, “Creating a dashboard with the right tool can greatly improve the management of complex project portfolios and can provide several key benefits. [The right tool provides] a cohesive view of project information for teams, stakeholders, and executives to stay aligned and up to speed on the latest developments; real-time visibility into timelines, budgets, statuses, resources, and performance metrics across multiple projects; and tracking and managing project risks, such as scope changes, cost increases, and major blockers, which allows you to proactively mitigate risks.”
Depending on the data you display in your dashboard, it can also allow you to “continuously monitor individual and collective project performance so you can evaluate success against targets and benchmarks,” says Knoepfel. Overall, she continues, this improves “efficiency and time savings with automated data visualization and reporting, saving time for project managers and executives.”
Vivian Au of Air Corporate adds, “Dashboards offer unparalleled transparency. They provide real-time insights into project health, enabling faster and better-informed decision-making.”
Furthermore, she continues, “Dashboards also help optimize resource allocation, as they make it easy to spot underutilized or overworked teams. They offer a visual representation of data that makes complex information accessible to everyone, from executives to team members.”
Challenges of Project Portfolio Dashboards
The challenges with project portfolio dashboards are getting the right level of detail, using real-time data instead of outdated information, and relying on unprocessed data. Manual data entry can lead to errors and delays, rendering the dashboard less useful.
Here are the most common pitfalls:
- Manual Data Entry and Updates: Even the most diligent teams are prone to human error. “The more manual data entry required, the greater the risk of producing errors and losing valuable time,” says Knoepfel. “This not only sacrifices efficiency, but it can lead to delays in reporting, inaccuracies, and data integrity issues, making the dashboard less reliable for decision-makers. It also increases the workload for managing the dashboard and reduces the ability to provide real-time insights.”
- Static Visualizations: Ideally, your dashboard should update in real time by pulling live data from underlying sheets or reports. When you use static visuals or dashboard elements that stakeholders can’t interact with, they are unable to see accurate data or explore projects in detail. As Knoepfel says, “Creating a dashboard that contains interactive elements or widgets (e.g., reports with filters, embedded videos, or embedded slides) that users can click on and engage with dynamically allows them to gain additional insights without needing to navigate away from the dashboard.”
- Limited Collaboration: Multiple users accessing and modifying the same file can cause version control issues with certain tools, especially static documents such as a PowerPoint deck or an Excel spreadsheet. “This can greatly limit teamwork and real-time collaboration, cause conflicting data, and make it difficult to track changes or updates effectively. Having a single source of truth enables consistency and accuracy, reduces duplicated efforts, and ultimately improves stakeholder decision-making,” says Knoepfel.
- Scalability Challenges: As projects scale, complexity inevitably grows. “Large datasets can become cumbersome to manage with limited tool capabilities, which makes it difficult to surface, visualize, and manage complex project interdependencies,” says Knoepfel. “Utilizing high-level dashboards, metrics, and reports that roll up data from multiple projects into a comprehensive portfolio view enables better decision-making and faster identification of key factors that affect the overall portfolio.”
Build Powerful, Real-Time Project Portfolio Dashboards With Smartsheet for Project Management
From simple task management and project planning to complex resource and portfolio management, Smartsheet helps you improve collaboration and increase work velocity -- empowering you to get more done.
The Smartsheet platform makes it easy to plan, capture, manage, and report on work from anywhere, helping your team be more effective and get more done. Report on key metrics and get real-time visibility into work as it happens with roll-up reports, dashboards, and automated workflows built to keep your team connected and informed.
When teams have clarity into the work getting done, there’s no telling how much more they can accomplish in the same amount of time. Try Smartsheet for free, today.


