What Is a Value Stream Map?
A value stream map is used in manufacturing and management to visually represent the steps that a product or service goes through, from order to final delivery. Use a value stream map to create a comprehensive view of a process in your business and identify inefficiencies and improvement opportunities.
Key Elements in a Value Stream Map
A value stream map has a few key elements that are necessary to demonstrate the flow of a product or process accurately.
- Changeover Time: This is the amount of time it takes for a machine to be reconfigured, rebooted, and cleaned, then have any necessary parts changed before starting a new part of the production process. This will be in the process box with the other process metrics.
- Cycle Time: Cycle time, also known as process cycle time, describes the time between one completed output and the next completed output. This will be in the process box along with other process metrics.
- Information Flow: Lines and arrows show the direction of the process and the timing and order of each process step.
- Kaizen Bursts: Kaizen, or Japanese for improvement, is used to describe a short-term improvement project — a Kaizen burst or Kaizen event — that can be implemented at different points in the process to make it more efficient. On a value stream map, Kaizen bursts are spiky circles.
- Lead Time: The value stream map should indicate the total amount of time taken from the start, when the customer orders a product or service, to the final product delivery, including all wait time. Lead time will be calculated in a timeline that runs at the bottom of the value stream map under the process boxes.
- Non-Value-Added Activity: Any part of the process that doesn’t add value should also be identified.
Process Metrics: Metrics also include defect rates, inventory levels, and anything else that speaks to the efficiency of each step. These, too, will be in the process box. - Process Steps: Each step in the service or production process is represented with a box on a linear map.
- Processing Time: The duration of each process step should be indicated on a value stream map in the process step box.
- Product Family: A product family is a group of products that go through a lot of the same processing steps. This can be identified using a product family matrix: a grid with a list of products on the left column and a list of the process steps undergone by each product on the top row. Mark each step that a product goes through, and you will be able to see which products go through similar steps.
- Takt Time: Takt, a term used in German to describe a beat or a pulse in music, describes how fast production needs to be to keep up with customer demand. This will be recorded in the process box.
- Value-Added Activity: Value stream maps should identify all parts of the process that add value to the product or service and benefits the customer.
How to Create a Value Stream Map
The value stream map is a type of Lean process map: It helps identify unnecessary bulk in your process and visualize how to make the process more efficient.
Learn more about this approach to eliminating waste and maximizing efficiency with this complete guide to Lean process improvement.
To create a value stream map, follow the steps below.
Define the Problem
Go through the entire process and outline the problems that you see. This is called walking the flow, a term for physically walking through each step of the process and gathering information.

Download a Project Problem Statement Template for
Microsoft Word | Adobe PDFAssemble a Team
Assemble all the relevant individuals and departments with pertinent knowledge about each step of the process for the Kaizen kickoff — a short, focused meeting to attack the issue at hand. Discuss the problem statement and determine what exactly needs to be mapped. Establish your schedule and assign responsibilities.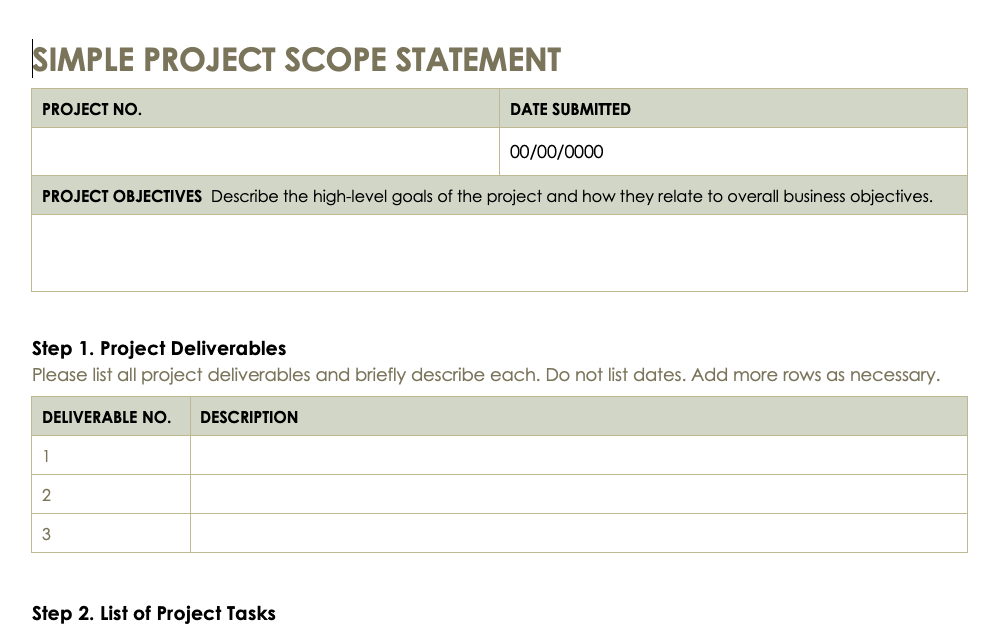
Download a Simple Project Scope Statement for
Draw a Current State Map
During this stage, you will want to walk the flow again, collect data and relevant metrics, and note any potential problems that you observe. Draw a box for each step of the process, starting with the order placement, and connect the boxes with arrows to demonstrate the direction of flow of materials and information. In each box, make sure to include lead time, cycle time, inventory levels, and any other process data you want to track. The final box will represent the stage of delivery to the customer.
At the bottom of the value stream map will be your value stream timeline, where your process time and lead time are indicated. Add these elements to calculate the total lead time before a product gets to a customer and compare it to the total processing time. You determine your activity ratio by dividing the total processing time by the total lead time.
Lay out your processes effectively with this complete workflow mapping toolkit.

Create a Future State Map
Conduct a value stream analysis on the current state map to identify process improvement. Note points of miscommunication, bottlenecks, excess wait times, overproduction or waste, and damage. Then create a map that depicts an improved version of your process, eliminating points of inefficiency. Identify excess time spent, scheduling that can be improved, or steps that can be simplified or eliminated.
This is also a good point in the process to determine your takt time and assess your finished goods inventory levels. Decide how much buffer stock and safety stock — product levels required to weather fluctuations in demand or supply — that you want to have in reserve.
Once you identify all issues, design the map similar to the current state map, but this time with the ideal flow. Once you identify all the areas for improvement, you can create a map that will address those areas with new flow steps.
Learn more about optimization with this guide to streamlining your work processes.

Implement an Action Plan
List out all the steps required to get from the current state map to the future state map. This could include improvements such as upgrading equipment, changing the process, or implementing new practices. Assign responsibilities to the appropriate team members, set timelines, and execute the plan.
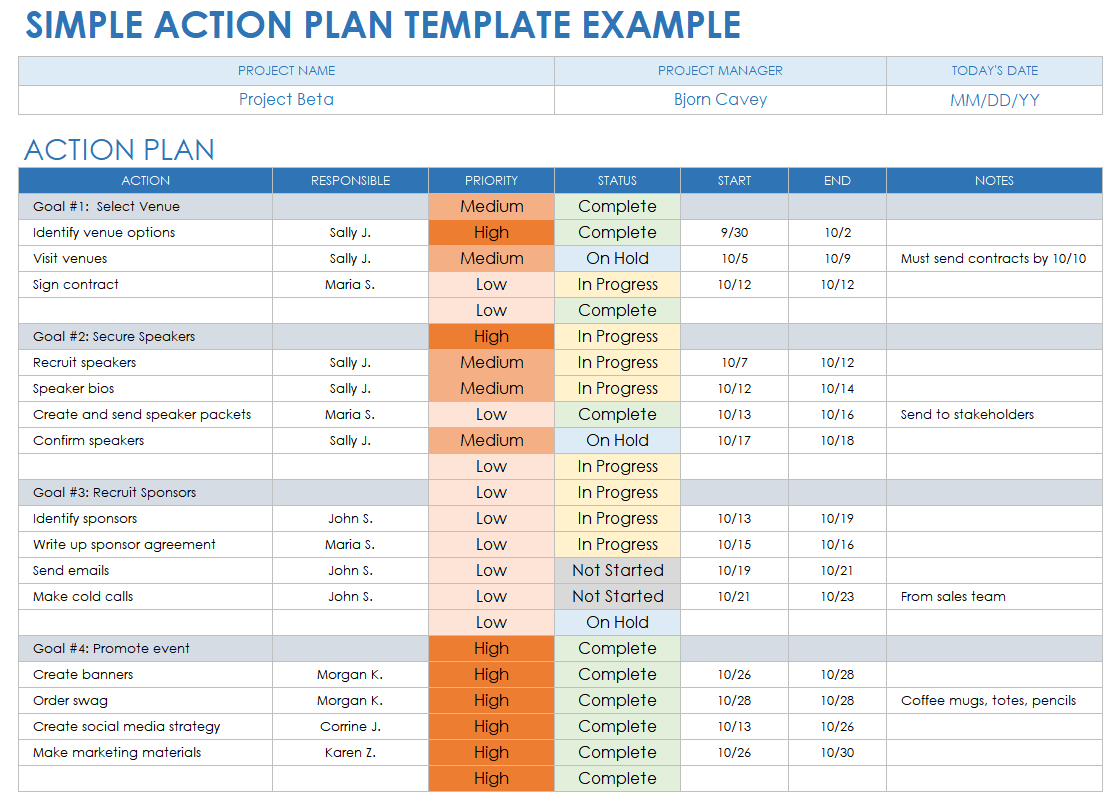
Download the Simple Action Plan Template for Excel
Read this value stream map case study to see an example of a value stream map enacted from start to finish.Monitor Action Plan
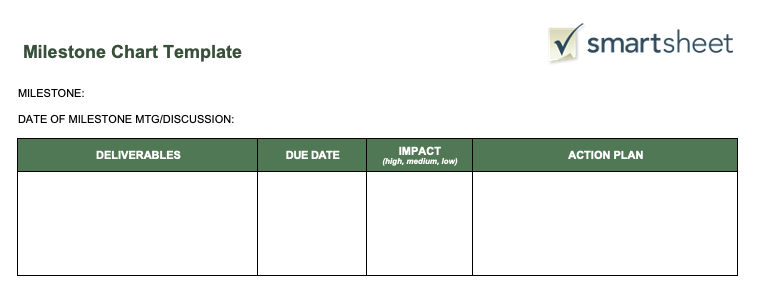
Monitor progress by scheduling regular check-ins with assigned team members and assessing the relevant data to make sure your process is improving. Write down deliverables and dates for checking in on the owners of every aspect of the action plan.
Value Stream Map Symbols
Use this value stream map symbols cheat sheet to help fill in your value stream map with all the necessary elements using clear symbols.
- Supplier and Customer Icon: These are both squares with a jagged top; they go at the beginning and end of the value stream map.
- Process Step Box: This box represents a step in the process and contains information about this particular step, including the duration, takt time, non-value-added time, and wastage.
- Push Arrow: This arrow with black and white checks on it demonstrates material moving from one process to the next.
- Shipment Arrow: This solid bolded arrow is used to indicate finished goods being sent to the customer.
- Electronic Information Line: This thin zig-zag line represents flow of electronic or digital information using the internet, WANs, LANs, or intranets.
- Kaizen Burst Icon: This jagged circle icon represents the Kaizen burst, a specific point in the process flow when there is a surge of short-term improvement activity.
- Shipment Icon: This icon of the shipment truck indicates final product delivery to the customer or shipment of materials for processing.
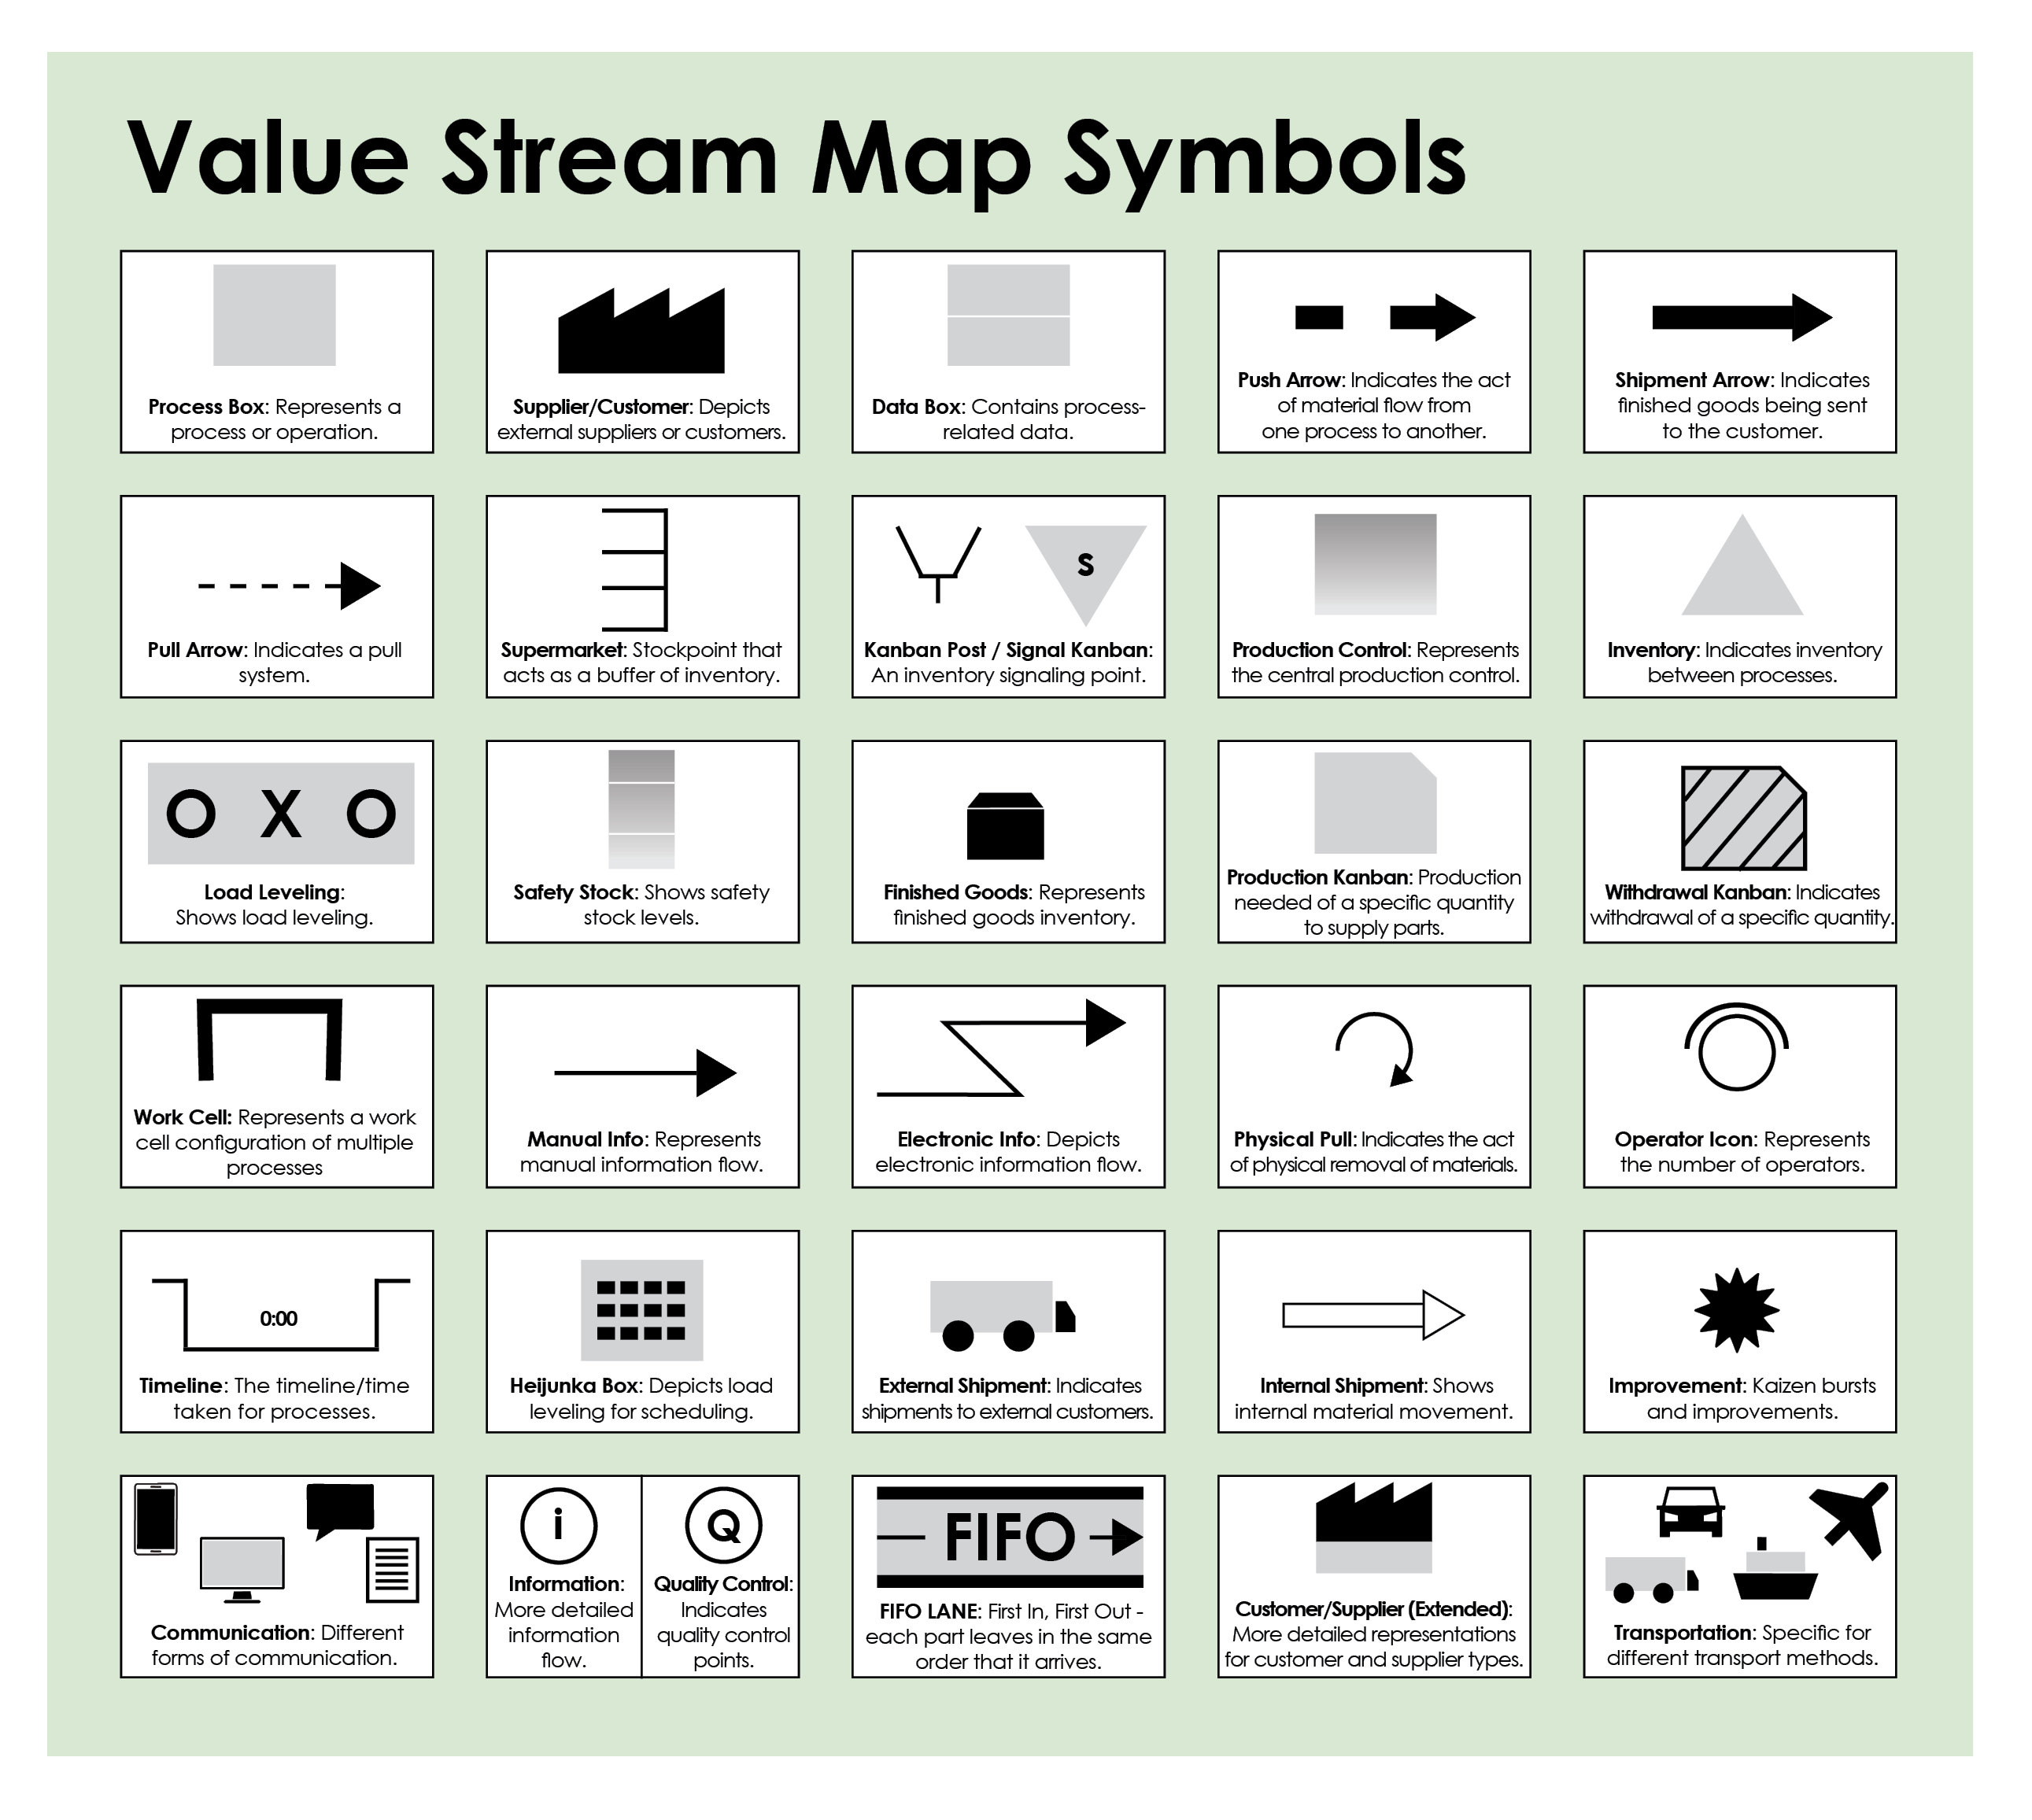
Download the Value Stream Map Symbols Cheat Sheet for Adobe PDF
Value Stream Map Examples
These different value stream map templates will help you get started on implementing value stream maps to optimize your processes.
Learn more about process maps with this essential guide to business process mapping.
Basic Value Stream Map: Use this template to lay out your process steps, calculate processing time, and visualize the entire supplier-to-customer process.
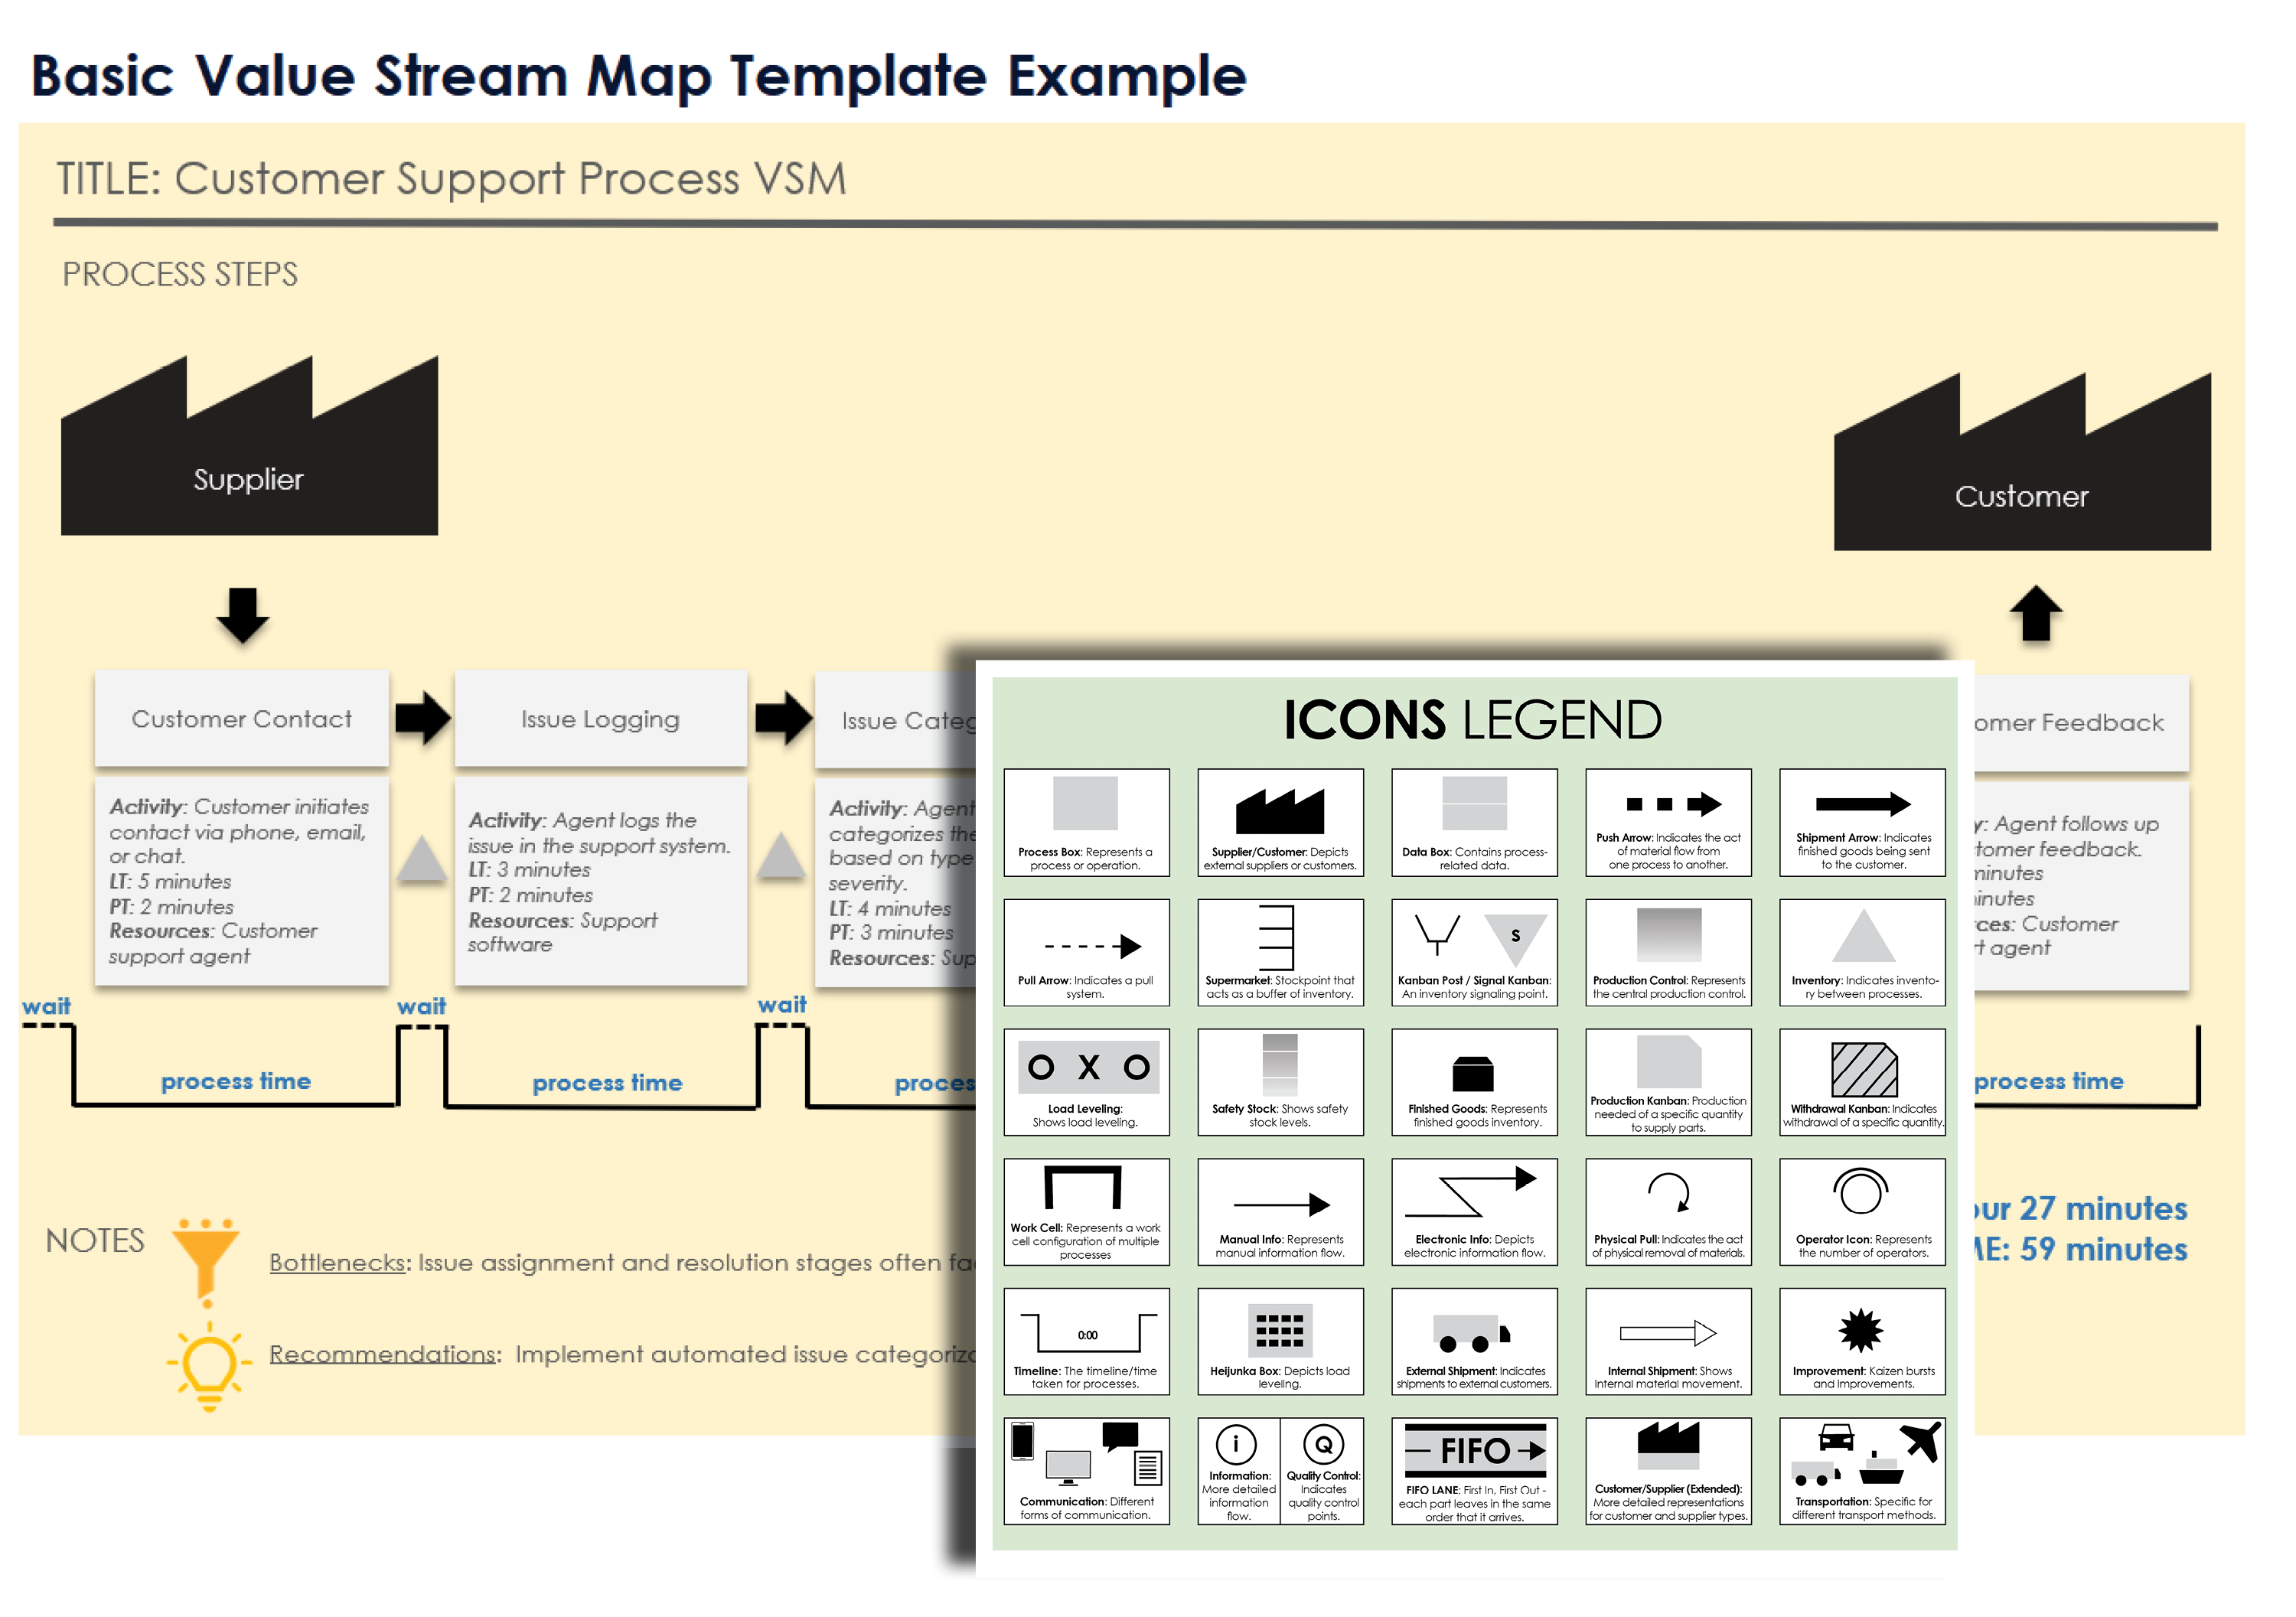
Download a Basic Value Stream Map Template for
Excel
|
Microsoft Word
| Google Docs
Current State Value Stream Map: This template lets you write out a more detailed breakdown for each process step so you can more easily visualize where to tackle potential issues.
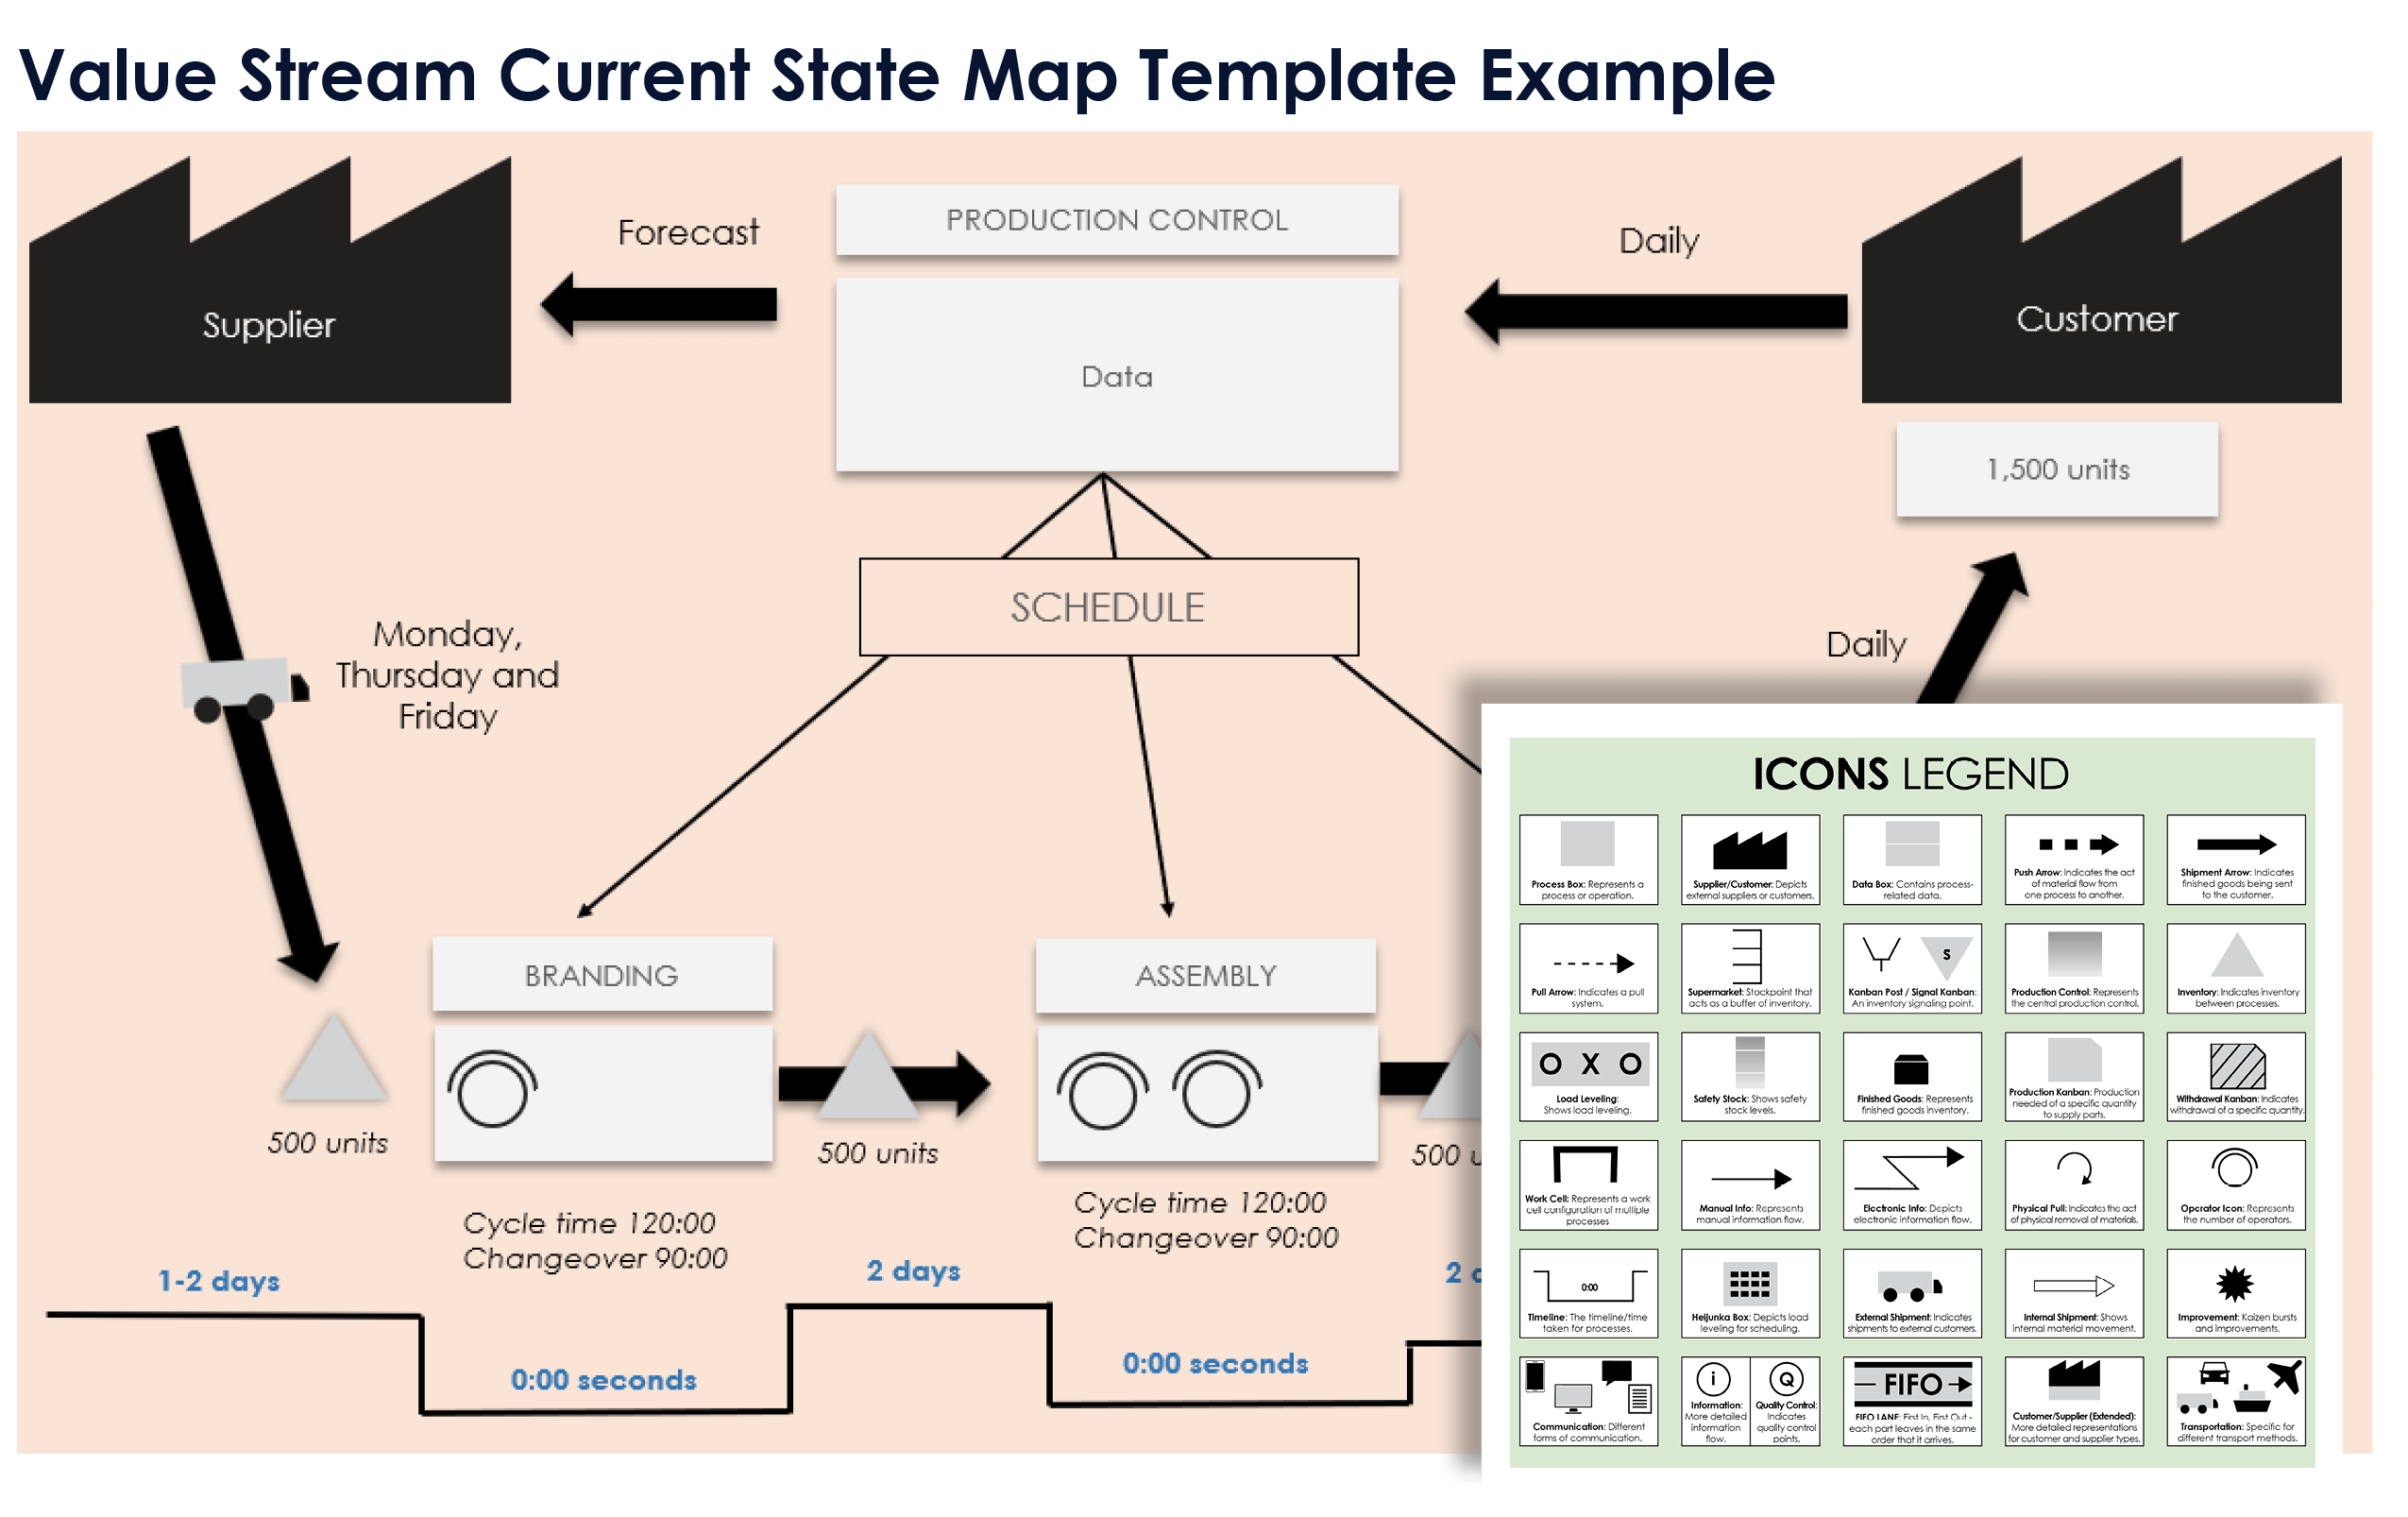
Download a Value Stream Current State Map Template for
Excel
|
Microsoft Word
|
PowerPoint
Future State Value Stream Map: This template is formatted to help you design your new proposed process. It includes sections where you can detail how a step can be improved.
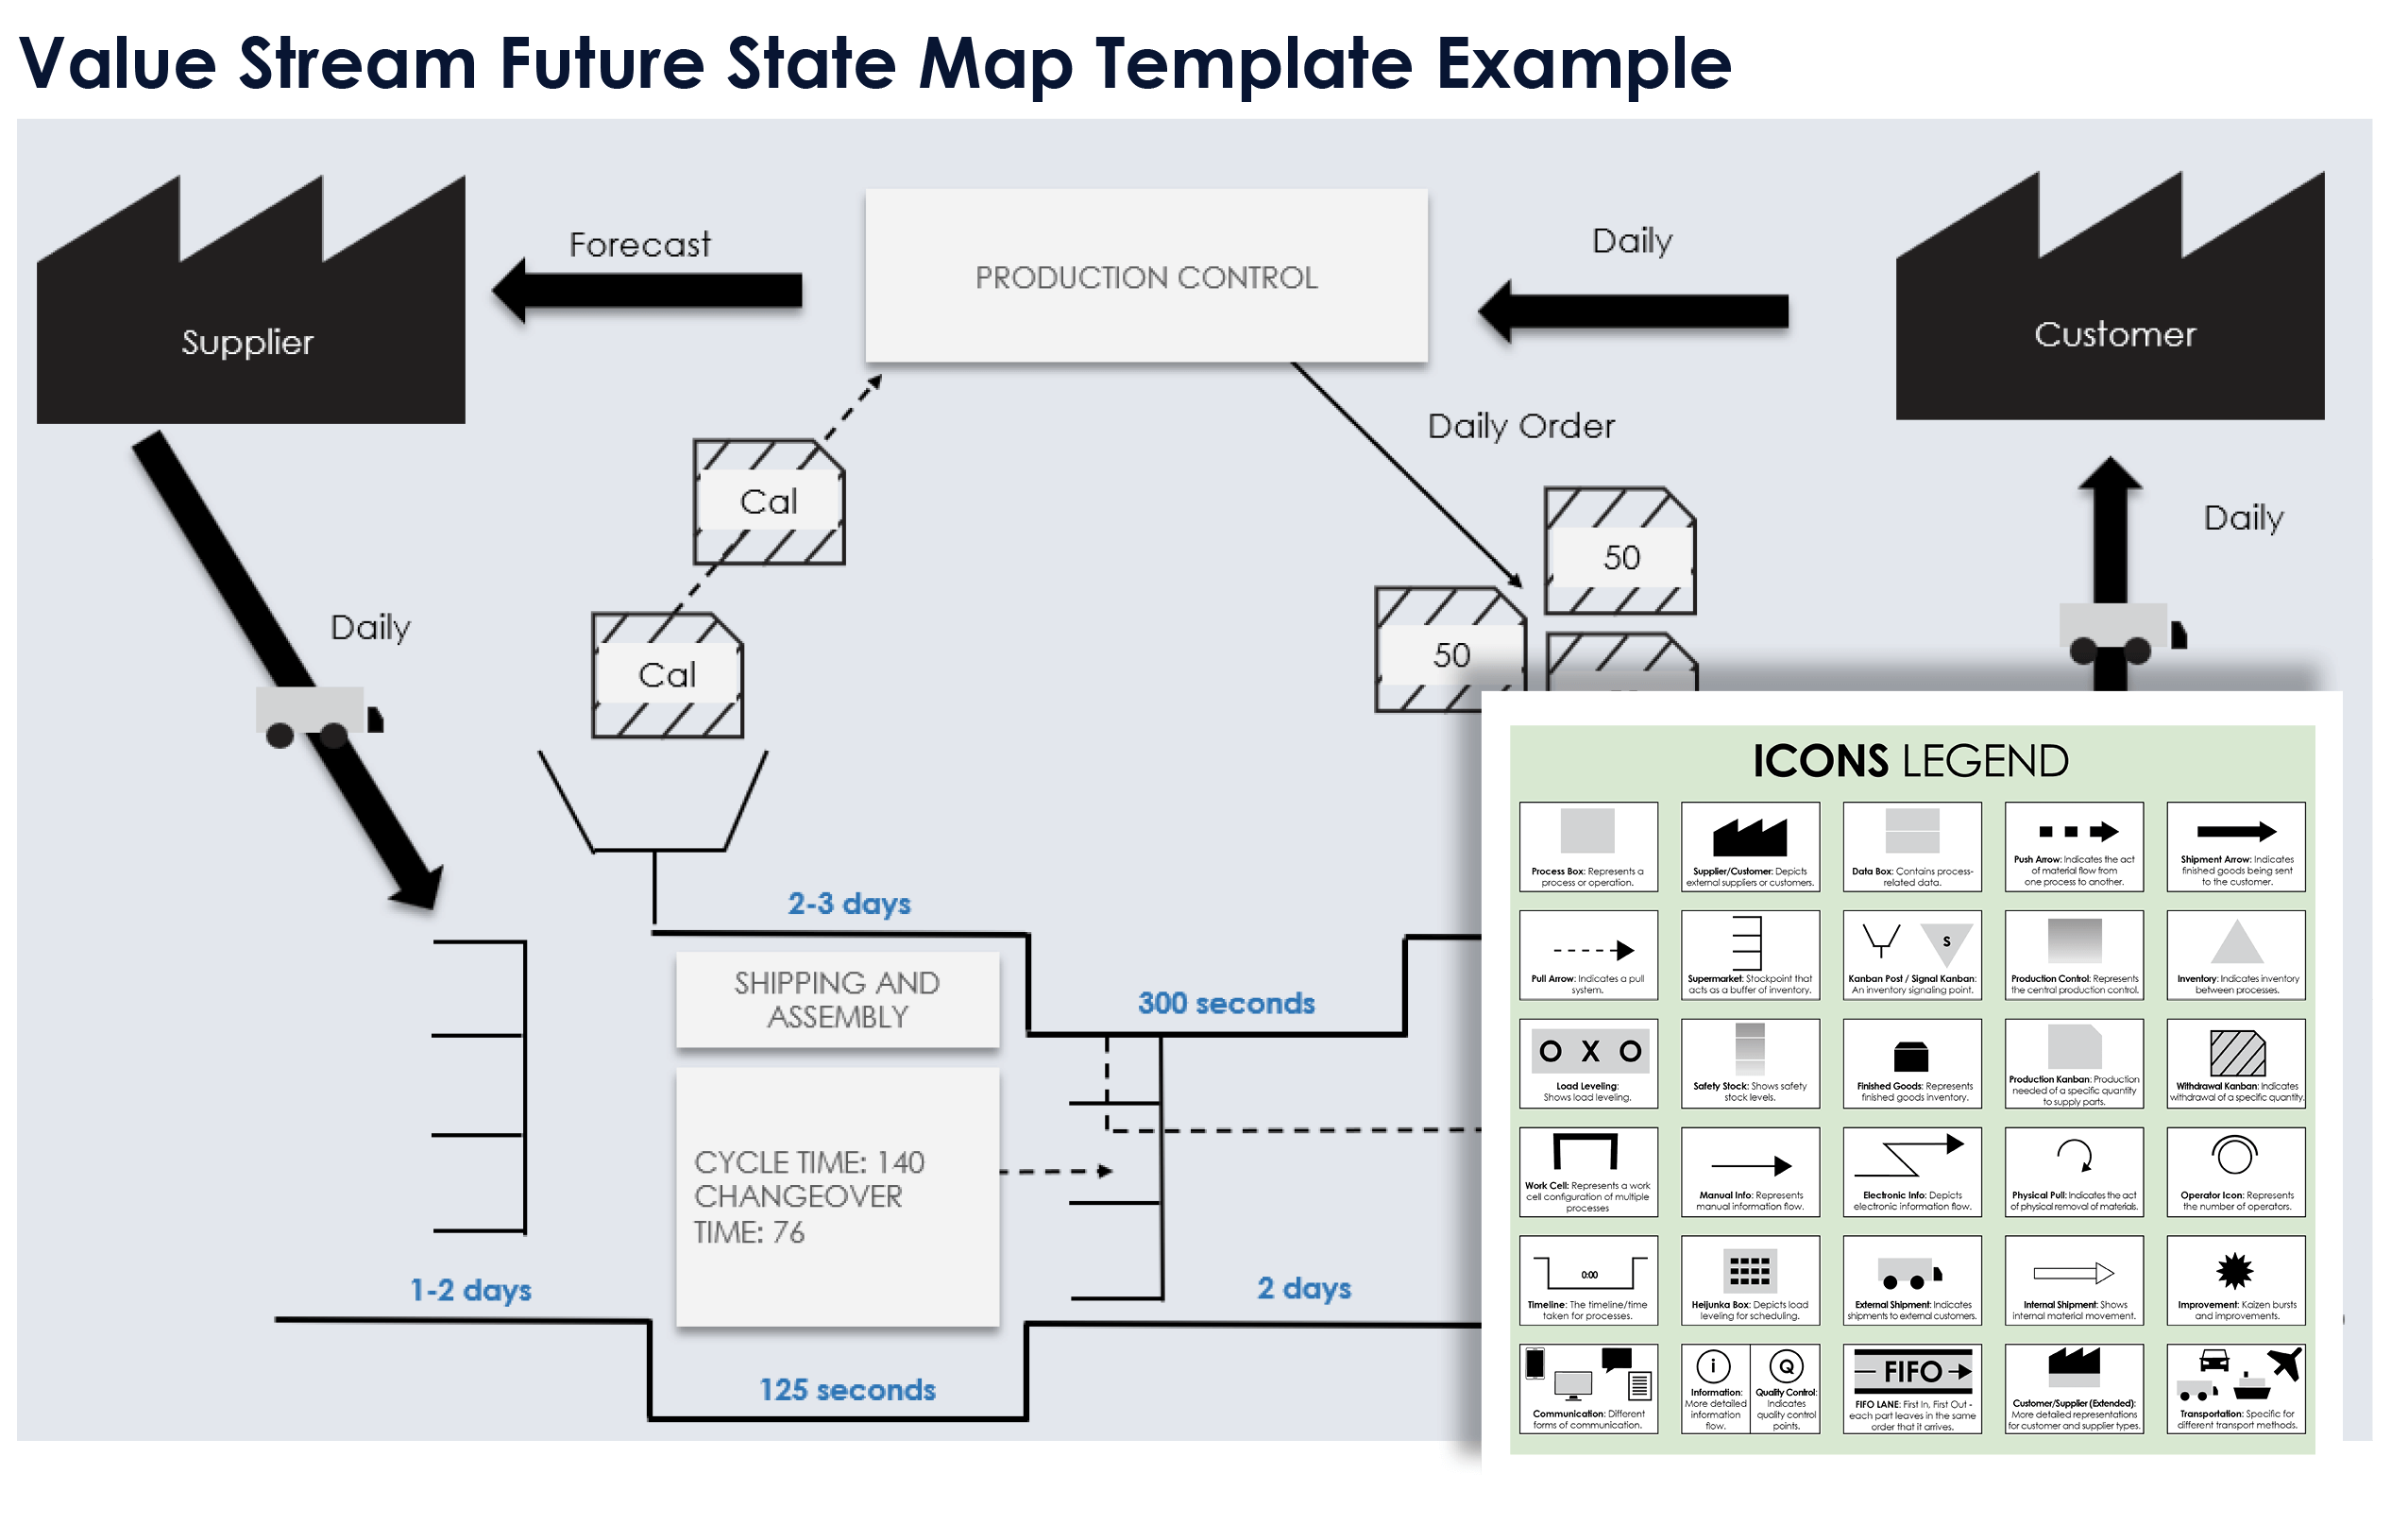
Download a Value Stream Future State Map Template for
Excel
|
Microsoft Word
|
PowerPoint
Extended Value Stream Map: Use this template if you need more advanced metric tools to map your process. The extended value stream map includes a pie chart visualizing value-added time, as well as bar charts for workload distribution, capacity, and costs.
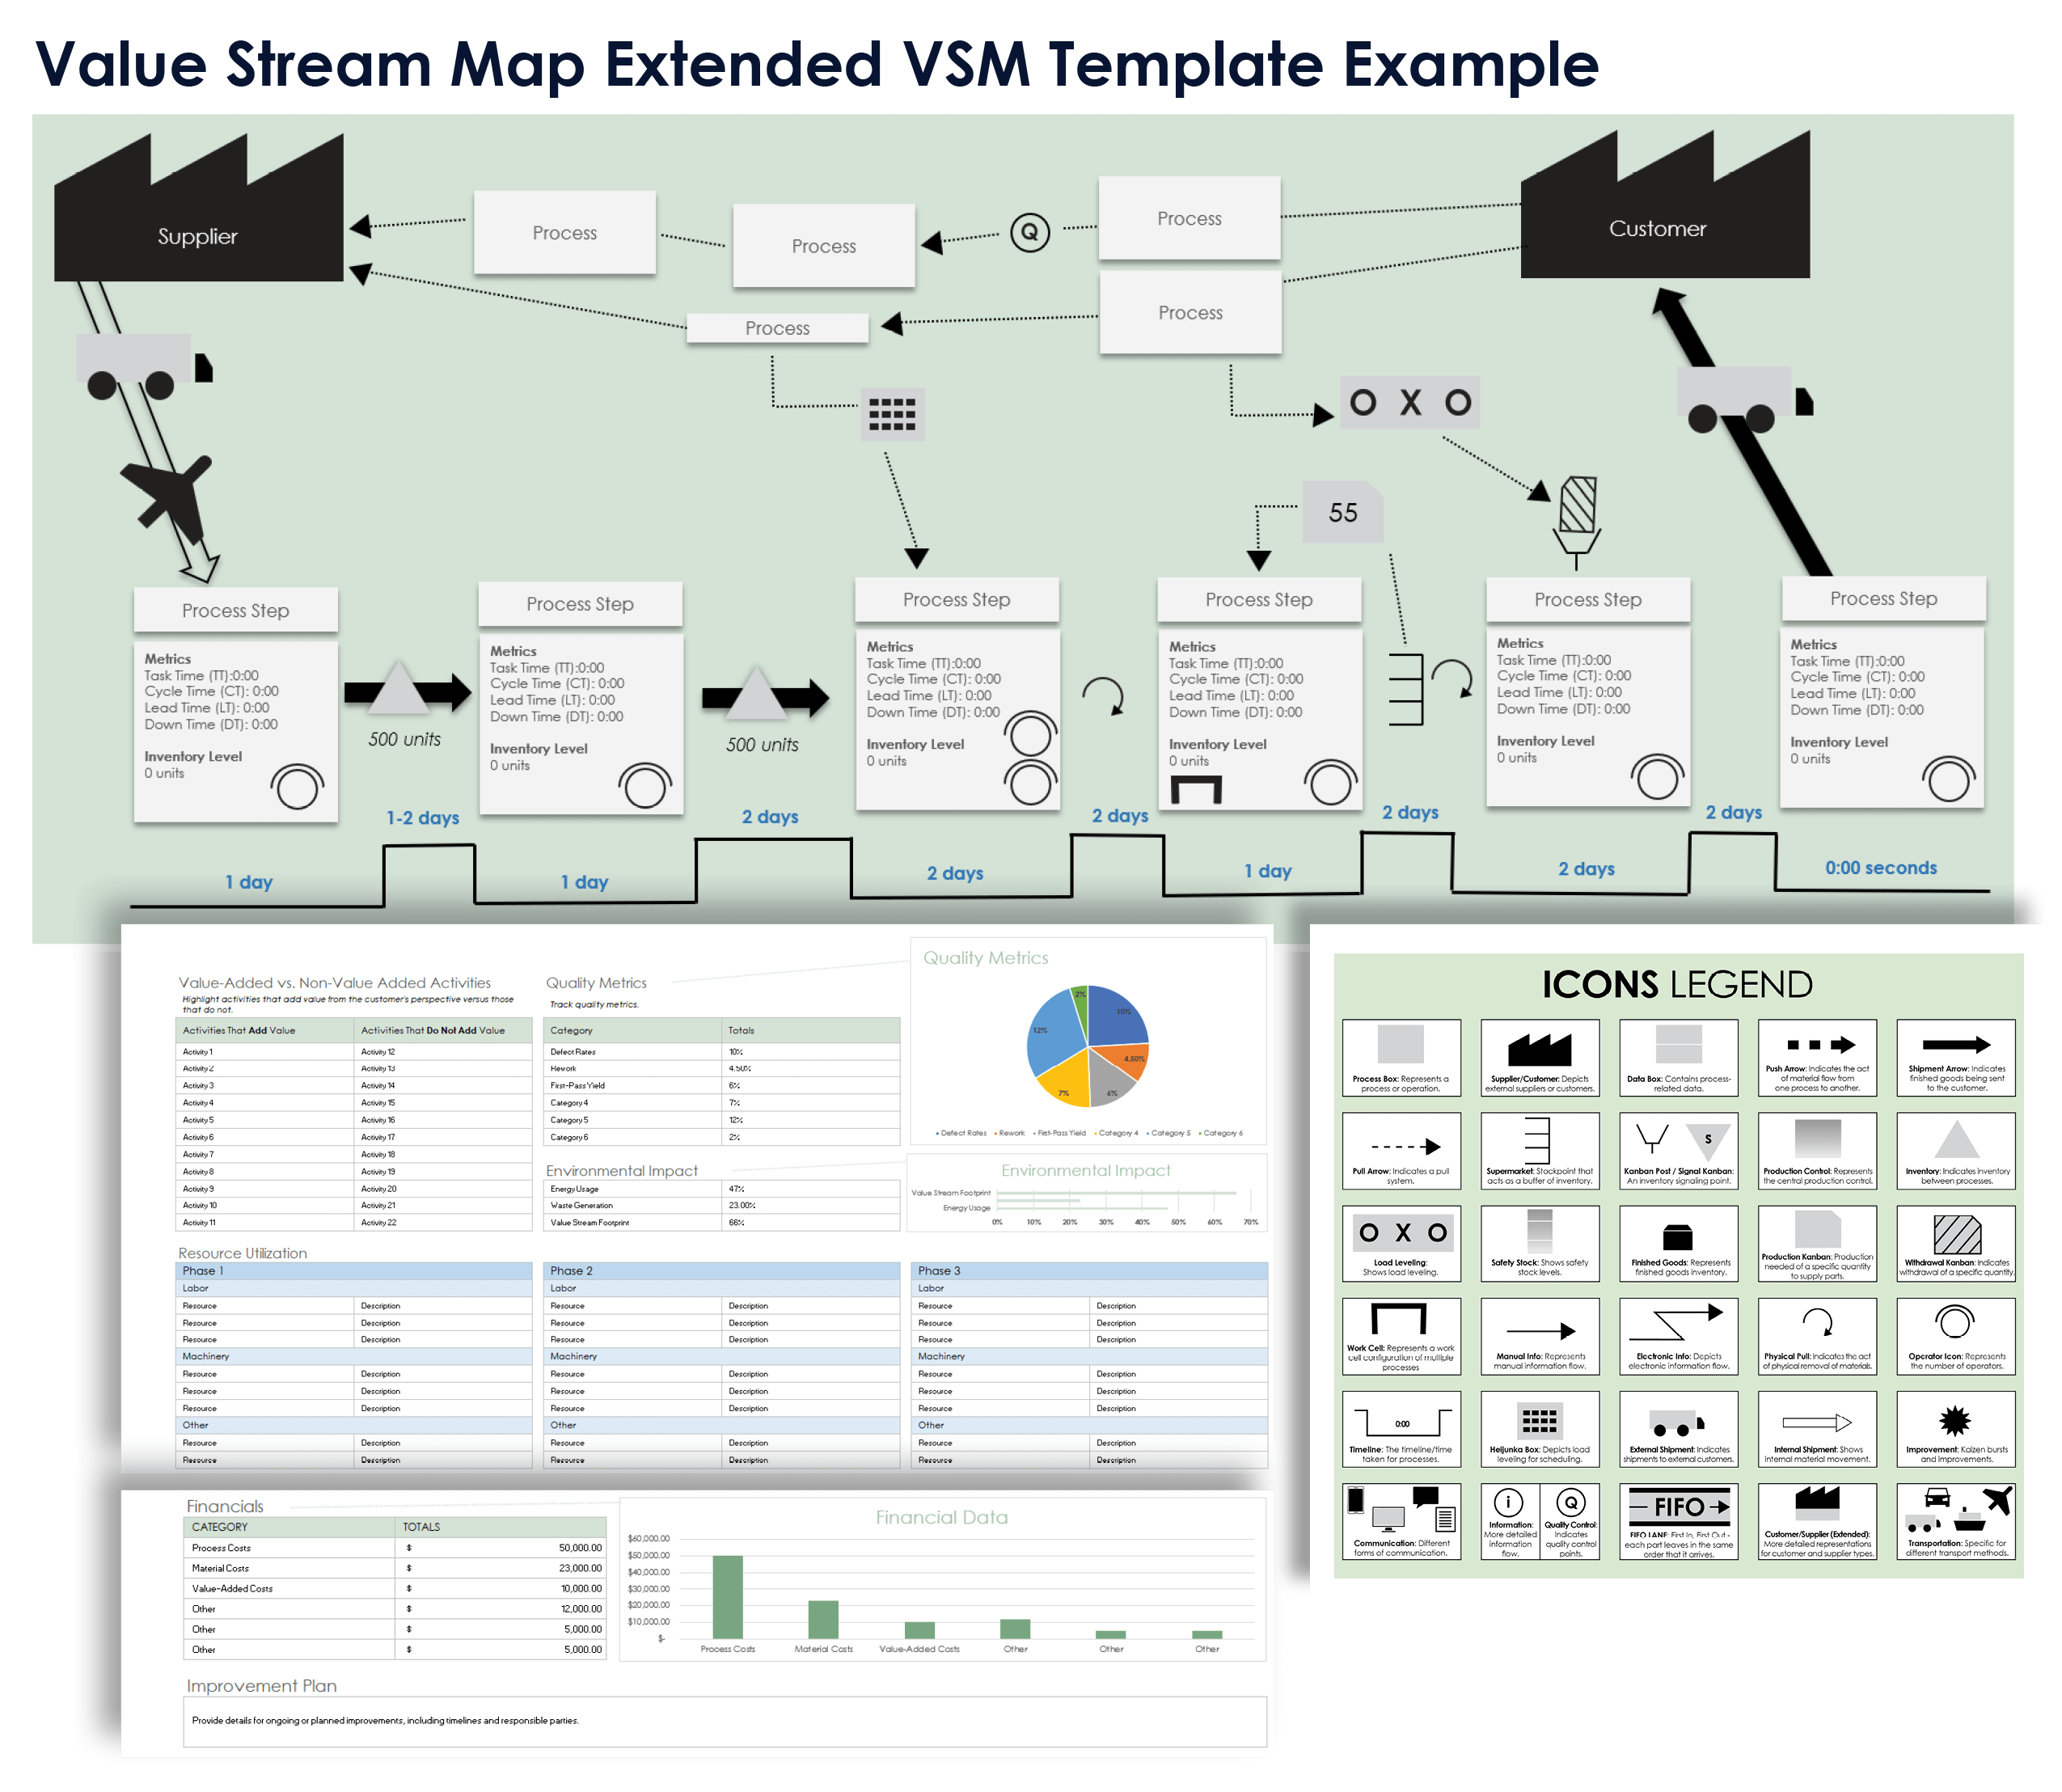
Download the Extended Value Stream Map Template for Excel
Expert Tips for Creating Effective Value Stream Maps
While creating your value stream map, it’s important to be as detailed as possible at each step. Include as much information as possible from the relevant owners and employees to better visualize the whole process and ensure that the map is useful for stakeholders at every level.
Be Detailed: A value stream map, regardless of the industry process it represents, should be as detailed as possible — mapping services is just as important as mapping products. Make sure your service value stream map is as detailed as a manufacturing one would be. If you want to read more about the application of value stream maps in the service industry specifically, read these case studies of value stream mapping in the service industry

Rod Morgan, the Head of Faculty at RPM-Academy, says, “When you work in the service sector, you’ll find that data is very difficult to acquire. We don't typically measure the things that are important.” Morgan emphasizes that it’s especially important to be aware of “actual value added” and “non-value-added time that’s being consumed.”Use Metrics: Morgan suggests creating an improved measurement system, regardless of your industry. Your value stream map should include details such as first-time accuracy, quality percentage, uptime, cycle time, and processing time.
Do a Process Walk: When creating your value stream map, you should walk the flow to be able to visualize its steps accurately. Morgan also suggests consulting the relevant employees at each step of the process to make sure you have as much accurate detail and information as possible: “Go back to each process and talk to the people that are in the room and ask them, ‘What goes wrong at this stage of the process? What are some of the failure modes?’ Because those two will help to inform your overall understanding of the value stream, as well as identify opportunities for improvements.”

Assign Ownership: According to Matt Rebeiro, a strategic advisor at the Process Design Institute, it’s useful to identify who is in charge of each step of the process on your value stream map. Use their full name, title, department, and responsibility, and include the map creator’s name in case any of the owners in the process have questions.
Clearly Distinguish Roles: Rebeiro suggests using color coding for each department and including a legend that explains each color code. He also suggests using color only on the outlines of the box instead of filling them in so the black text can properly contrast. Include operational definitions in an appendix about what is value added, what is non-value added, and what is business value added.
Keep the Audience in Mind: A value stream map “should never be designed just for your needs,” Rebeiro says. “It should be used as an asset in conversations from the frontline all the way up to executives.” Also keep cultural or linguistic contexts in mind: For example, some languages are written from right to left, so use arrows to make sure directionality is clear.
How AI Can Help With Value Stream Mapping
AI can help with value stream mapping in multiple ways. It can automate data collection and analysis. Analysis can reveal bottlenecks and potential points for improvement and process optimization.
AI can also identify patterns to help predict future bottlenecks, process errors, production delays, and fluctuations in demand and supply. It can even suggest new pathways to avoid these predicted outcomes.
Automating data collection and analysis cuts down on repetitive tasks and human error. AI value stream map generators can update your map in real time so it has the most recent data and can flag problems immediately for employees to quickly address.
AI programs can identify the root causes of problems in your processes, as well as value-added activities, non-value-added activities, and waste. They can implement security protocols such as identity verification, and utilize scanners to test for vulnerabilities that your team can identify and fix. AI programs can also process customer feedback, see where customer feedback data and production process data are informing each other, and create evaluative summaries that enable holistic analysis and optimization.
Boost Efficiency in Your Processes with Real-Time Work Management in Smartsheet
Empower your people to go above and beyond with a flexible platform designed to match the needs of your team — and adapt as those needs change.
The Smartsheet platform makes it easy to plan, capture, manage, and report on work from anywhere, helping your team be more effective and get more done. Report on key metrics and get real-time visibility into work as it happens with roll-up reports, dashboards, and automated workflows built to keep your team connected and informed.
When teams have clarity into the work getting done, there’s no telling how much more they can accomplish in the same amount of time. Try Smartsheet for free, today.